| ü | Successfully closed the $1.89 billion acquisition of SourceGas Holdings LLC, which increased our customer base by approximately 55 percent to more than 1.2 million customers, expanded our presence in Colorado, Nebraska and Wyoming and added Arkansas to our service territories; Successfully closed and integrated the acquisitions of MGTC and Energy West Wyoming, positioning us for additional growth through increased natural gas distribution reach in Wyoming;
Improved our liquidity and raised funds for the SourceGas transaction through a number of transactions, including:
| | -ü | ExtendedCompleted essentially all the termSourceGas integration activities in only 10.5 months; | | ü | Took advantage of ourthe low interest rate environment, financing the SourceGas transaction and refinancing existing debt; | | * | Issued $300 million, 3.95 percent, 10-year senior unsecured notes and $250 million, 2.50 percent, 3-year senior unsecured notes in January; | | * | Issued $400 million, 3.15 percent, 10-year senior unsecured notes and $300 million, 4.20 percent, 30-year senior unsecured notes in August; | | * | Entered into a $500 million, three-year, unsecured term loan at 95 basis points over LIBOR; and | | * | Upsized our corporate revolving credit facility to 2020; |
| $750 million; | -ü | Issued a $300Implemented our At-the-Market equity offering program and issued approximately 2 million unsecured term loan, replacing a $275 term loan that matured during the year; and |
| | - | Put in place permanent equity financingshares at an average price of $60.95 per share for the SourceGas acquisition throughtotal net proceeds of $246 million from the issuance of 6.325 million common shares and $290 million from the issuance of 5.98 million equity units; |
| $118.8 million; | (1)
ü | Earnings per share from continuing operations, as adjusted is a non-GAAP measure. See Appendix A for a reconciliation of the non-GAAP measure to our results as reported under GAAP. |
Invested in our utility infrastructure and systems: | | - | Received final approvals and began* | Completed construction of a $65and placed in service our $63 million, 40 megawatt simple-cycle gas turbine at the Pueblo Airport Generating Station; |
| | -* | Received approval toClosed the purchase of and placed in service nearly two months ahead of schedule the $109 million, 60 megawatt Peak View Wind Project; |
| * | Completed construction of and placed in service the first segment of our $54 million, 144-mile transmission line from northeast Wyoming to Rapid City, South Dakota; | - | Received approval from the Wyoming Public Service Commission for a Certificate* | Continued construction of Public Convenience and Necessity to construct the Wyoming portion of a $54 million, 230-kV, 144 mile long transmission line. Approval from the South Dakota Public Utilities Commission to construct the South Dakota portion of the line was received in late 2014; |
| | - | Began construction on a $70 million corporate headquarters in Rapid City, South Dakota, which will provide efficiencies and replace expenses associated with our five existing facilities throughout Rapid City; and |
| * | Closed the purchase of a 37-mile segment of natural gas pipeline in southwest Kansas, providing additional gas supply to customers and adding the opportunity to provide service to customers along 87 miles of previously inaccessible transmission pipeline; | -ü | Filed for approvalExecuted our strategic initiative to sell a non-controlling 49.9 percent interest in Black Hills Colorado IPP’s 200 megawatt, combined-cycle natural gas generating facility located in Pueblo, Colorado; | | ü | Completed the sales of several non-core oil and gas properties as part of the execution of our Cost of Service Gas ("COSG")strategic initiative across six regulatory jurisdictions, creating the potential for initial implementation of the program in late 2016. The COSG program is designed to provide long-term naturalde-emphasize our oil and gas price stability for our utility customers, while providing earnings opportunities for our shareholders; |
Initiated a strategic assessment to sell up to 49.9 percent of Black Hills Colorado IPP ("Colorado IPP") to monetize assets under favorable terms. Colorado IPP owns and operates a 200 megawatt, combined-cycle natural gas generating facility located in Pueblo, Colorado. Market conditions provided a unique opportunity to capture a premium valuation while continuing to support reliable service in our utilities. An agreement to sell the 49.9 percent interest was executed in February 2016;
Continued to prove up the significant shale gas resource in the Piceance Basin by successfully completing our 2014/2015 drilling program, with strong results;
Implemented important organizational changes in our oil and gas business to reduce costs;
Made the strategic decision to de-emphasize our oil and gas business and refocus our oil and gas professionals on the support of utility COSG programs;
Provided the safe and reliable service our communities and customers depend on and achieved several notable operational performance metrics:
| business; | -ü | Continued to make excellent progress on our diversity initiatives, increasing the female representation on our Leadership Team (top 30 employees) to approximately 30 percent and increasing our Board diversity to 40 percent (3 females and 1 Native American); | | ü | Included on Forbes 2016 list of Best Mid-Size Employers; and | | ü | Provided the safe and reliable service our communities and customers depend on and achieved several notable operations performance metrics: | | * | Safety performance total case incident rate of 1.21.7 compared to an industry average of 2.1; |
| 2.4; | - | * | 1st Quartile reliability ranking for our three electric utilities compared to industry averages; |
| | -* | Power generation fleet availability of 93 percent for coal-fired generation and higher for our gas-fired, diesel- fired and wind generation; |
| 98 percent; | - | * | Completed fourfive years with favorable MSHA safety results at our coal mine compared to other coal mines located in the Powder River Basin, received the Governor of Wyoming’s Workplace Safety Award for the third consecutive year, and received an award from the State of Wyoming for sixseven years without a lost time accident; and |
| | - | * | JD Power Customer Satisfaction Survey indicated our Electric and Gas Utilities were favorable to our peers in the Midwest;Midwest. |
Received the Freedom Award from the US Department of Defense in recognition of our support for veterans and employees serving
RETURN TO SHAREHOLDERS
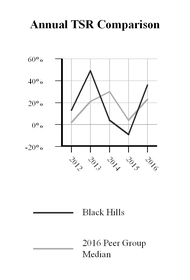
The following chart shows how a $100 investment in the National GuardCompany’s common stock on December 31, 2011 would have grown to $217 on December 31, 2016, with dividends reinvested. The chart also compares the total shareholder return on the Company’s Common Stock to the same investment in the S&P 500 Index, S&P 500 Utilities Index and Reserves. Thisthe S&P Midcap Electric Utilities over the same period. We have used the S&P Midcap Electric Utilities Index in the past for the published industry index. However, with our recent acquisitions of gas utilities we feel the S&P 500 Utilities Index is the highest recognition provided by the Department of Defense to civilian organizations.more appropriate. Both indices are used this year for comparison purposes.
2015 Performance Results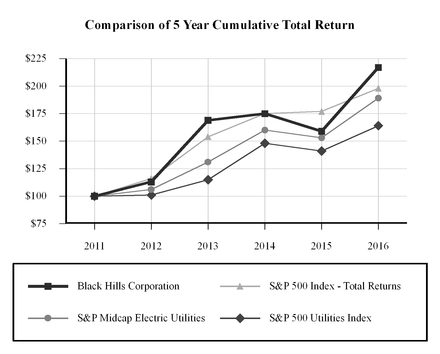
2016 PERFORMANCE RESULTS
Our corporate financial goals are used as measures to determine awards under our variable pay programs. The following table summarizes our 20152016 performance measures and results.
| | | | | | | Pay Element | | Performance Measure | | 20152016 Results | | | | | | | Short-term Incentive
| | EPS from ongoing operations, as adjusted, target of $3.00set at $2.99 | | $2.95 $3.19 per share for incentive plan purposes
Payout of 92%166% of Target | | | | | | | Long-term Incentive - Performance Share Award
| | Total Shareholder Return (TSR) relative to our Peer Group measured over a three-year period | | TSR 34%28%
2324rdth Percentile Ranking in Peer Group
No Payout |
PAY FOR PERFORMANCE
A key component of our executive compensation program is to link pay to performance. 2016 was a transformational year for Black Hills Corporation, closing the SourceGas transaction on February 12th, the largest transaction in company history. Several milestones were achieved associated with this transaction, including receiving all regulatory approvals within seven months of announcement (four months faster than the average of recently utility transactions) and substantially completing all integration activities within 10.5 months after transaction close. The transaction increased our customer base by 20
approximately 55 percent to 1.2 million customers and increased our total assets by almost 40 percent to $6.5 billion. The transaction increases our business, regulatory and geographic diversity, strengthens our business risk profile and supports maintaining our solid investment grade credit ratings. In addition, it provides increased cash flows and earnings to support further utility investments, fund future dividends and drive shareholder value.
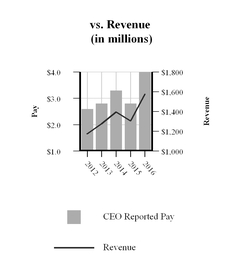
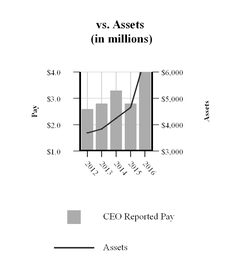
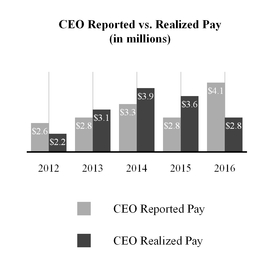
The charts below illustrate the directional relationship between the compensation of our CEO as reported in the Summary Compensation Table (excluding the change in pension value) and company performance for the last five years.
Since a large percentage of the CEO’s pay as reported in the Summary Compensation Table represents potential pay, we believe it is also important to look at pay actually realized each year. The following graphic shows reported pay and realized pay over the last five years.
| | | | | Reported pay includes base salary, actual annual incentive earned, the grant date fair value of a long-term equity compensation and all other compensation, excluding the change in pension value, each as reported in the Summary Compensation Table. | | | | Realized pay includes base salary, actual annual incentive earned and all other compensation, each as reported in the Summary Compensation Table, and the value of stock awards released in the applicable year. | | | | |
Key Executive Compensation Objectives and 2015 Compensation Decisions
KEY EXECUTIVE COMPENSATION OBJECTIVES AND 2016 COMPENSATION DECISIONS
Overall, our goal is to target total direct compensation (the sum of base salary, short-term bonus incentives at target and long-term incentives at target) at the median of the appropriate market when our operating results approximate average performance in relation to our peers.
Our executive compensation is designed to maintain an appropriate and competitive balance between fixed and variable compensation components, short- and long-term compensation, and cash and stock-based compensation. The total target compensation mix for our Named Executive Officers in 2015 averaged approximately:
40 percent fixed and 60 percent variable;
60 percent base and short-term incentive and 40 percent long-term incentive; and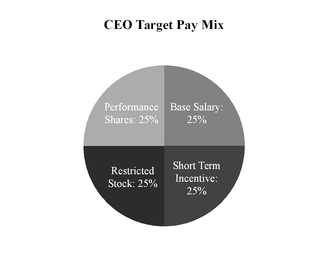 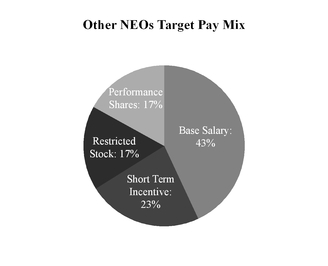 50 percent cash and 50 percent equity. | | | | | | | | | Variable | 75 | % | | Variable | 57 | % | | Linked to Share Value | 50 | % | | Linked to Share Value | 34 | % |
We believe that the performance basis for determining compensation should differ by each reward component – base salary, short-term incentive and long-term incentive. Incentive measures (short-term and long-term) should emphasize objective, quantitative operating measures. The performance measures for our incentive compensation plans are as follows:
| | • | Base Salary – Merit increases for our Named Executive Officers' base salary averaged 3.4 percent in 2015, excluding Mr. Kinzley's salary due to his January 1, 2015 promotion to CFO, based on the individual executive’s performance and to approximate the market medianBase Salary Merit increases for our Named Executive Officers' base salary averaged 4.7 percent in 2016, excluding the salaries of Messrs. Kinzley and Iverson. The base salary increases took into scope the increased size of the Company as a result of the SourceGas acquisition. The individual base salaries also reflect the individual's performance, tenure, experience and market compensation for comparable positions in our industry and peer group. Recognizing Mr. Kinzley is a first time CFO, his base salary was targeted at the 25th percentile of the market data. |
Mr. Kinzley was promoted to CFO in 2015 and Mr. Iverson was promoted to GC in 2016. Both individuals received a 10.0 percent increase in their base salaries. After the increases, Mr. Kinzley’s base salary was slightly below the 50th percentile of the market data and Mr. Iverson’s base salary was slightly below the 40th percentile of the market data, reflecting the fact that these executives are relatively new to their respective roles within the Company. Short-Term Incentive – The short-term incentive is based on earnings per share targets. The Committee believes that this performance measure closely aligns the executives’ and our shareholders’ interests and fosters teamwork and cooperation.
| | -* | The 20152016 short-term target incentive as a percent of base pay remained the same as the prior year at 90 percent, 65 percent, 5045 percent and 45 percent for our CEO, COO, - Utilities, CFOGC, and Sr. V.P. - General Counsel,CIO, respectively. It was increased for our Sr. V.P. - Human ResourcesCEO from 4090 percent to 45100 percent trending towardsand for our CFO from 50 percent to 60 percent, adjusting to approximate the market median for general industry.median. |
| | -* | Based on the attainment of pre-established performance goals, the actual payout can range from 50 percent to 200 percent of target. |
| | -* | The Committee selected an earnings per share goal based on ongoing operations, as adjusted, of $3.00$2.99 as the 20152016 corporate goal. The Committee set the goal taking into consideration the full year impact on earnings from financing the SourceGas transaction with only a partial year of operations contributing. |
| | -* | Our 20152016 earnings for the Short-Term Incentive Plan were $2.95$3.19 per share, which was 27 percent belowabove our target earnings per share goal, resulting in a payout of 92166 percent of target. |
Long-Term Incentive – The long-term incentive is delivered 50 percent in performance shares and 50 percent in restricted stock that vests ratably over a three-year service period and 50 percent in performance shares.period. Entitlement to the performance shares is based on our total shareholder return over a three-year performance period compared to our peer group. This performance measure was chosen
because it mirrors the market return of our shareholders and compares our performance to that of our peer group. Target payout occurs if our performance is at the 50 th percentile of our peer group.
*2016 Long-Term Incentive Value The 2016 long-term target incentive was adjusted for all the Named Executive Officers reflecting the market median compensation level for the increased size of the Company.
*Performance Share Plan Payment | | - | Our total shareholder return for the three-year period, January 1, 2013 through December 31, 2015, was 34 percent, which ranked below the threshold 30th percentile of our peer group, resulting in no payout for our Named Executive Officers.Our total shareholder return under the performance plan criteria for the three-year period, January 1, 2014 through December 31, 2016, was 28 percent, which ranked below the threshold 30th percentile of our peer group resulting in no payout. The Company’s performance was hampered with only a partial year of SourceGas operations included, while total Company earnings were diluted from the equity issued in late 2015 to finance the SourceGas acquisition. |
*Restricted Stock Grant | | - | Consistent with prior years, the Committee awarded 50 percent of the Named Executive Officers’ long-term incentive in restricted stock that ratably vests over three years. |
Consistent with prior years, the Committee awarded 50 percent of the Named Executive Officers’ long-term incentive in restricted stock that ratably vests over three years.
Special Achievement Awards The year 2016 was a transformational year for us with the acquisition of SourceGas. As a special recognition of the key contributions each officer made to successfully prepare for and close this transaction in only seven months (four months faster than the average of recent utility transactions), the Committee awarded special achievement awards to the officers taking into account each individual officer's involvement with and contribution to the transaction. The transaction completion bonuses were awarded in the form of restricted stock that vests ratably over three years.
Governance Best Practices We also have several governance programs in place to align our executive compensation with shareholder interests and to mitigate risks in our plans. These programs include stock ownership guidelines, an anti-hedging policy and clawback provisions in our short-term and long-term incentive award agreements.
In total, the Committee believes that the 20152016 compensation actions, decisions and outcomes strongly reflect and reinforce our compensation philosophy and in particular emphasizes the alignment between compensation and both performance and shareholder interests. At our 20152016 annual meeting, shareholders owning 9596 percent of the shares voted on this matter approved our executive compensation for 2014,2015, which we consider highly supportive of our current compensation philosophy. In connection with establishing the 20152016 executive compensation program, the Board reviewed the results of the say on pay vote, as well as market data and performance indicators. No significant design changes were made.
Setting Executive CompensationSETTING EXECUTIVE COMPENSATION
Based upon our compensation philosophy, the Committee structures our executive compensation to motivate our officers to achieve specified business goals and to reward them for achieving such goals. The key steps the Committee follows in setting executive compensation are to: analyze executive compensation market data to ensure market competitiveness; | | | | | | | Analyze executive compensation market data to ensure market competitiveness |
review the components of executive compensation, including base salary, short-term incentive, long-term incentive, retirement and other benefits;review total compensation mix and structure; | | | | | | | Review the components of executive compensation, including base salary, short-term incentive, long-term incentive, retirement and other benefits |
review executive officer performance, responsibilities, experience and other factors cited above to determine individual compensation levels. | | | | | | | Review total compensation mix and structure |
| | | | | | | Review executive officer performance, responsibilities, experience and other factors cited above to determine individual compensation levels |
Market Compensation Analysis
The market for our senior executive talent is national in scope and is not focused on any one geographic location, area or region of the country. As such, our executive compensation should be competitive with the national market for senior executives. It should also reflect the executive’s responsibilities and duties and align with the compensation of executives at companies or business units of comparable size and complexity. The Committee gathers market information for our corporate executives from the electric and gas utility industry and also reviews general industry data as an additional reference.
The Committee selects and retains the services of an independent consulting firm to periodically: provide information regarding practices and trends in compensation programs;review and evaluate our compensation program as compared to compensation practices of other companies with similar characteristics, including size and type of business; | | | | | | | Provide information regarding practices and trends in compensation programs |
review and assist with the establishment of a peer group of companies; andprovide a compensation analysis of the executive positions. | | | | | | | Review and evaluate our compensation program as compared to compensation practices of other companies with similar characteristics, including size and type of business |
| | | | | | | Review and assist with the establishment of a peer group of companies |
| | | | | | | Provide a compensation analysis of the executive positions |
The Committee used the services of Willis Towers Watson to evaluate 20152016 compensation. Willis Towers Watson gathered data from nationally recognized survey providers, as well as specific peer companies through public filings, which included: Willis Towers Watson’s 2014 Compensation Data Bank (energy services and general industry); and
23 peer companies representing the utility and energy industry.
| | | i. | Willis Towers Watson’s 2015 Compensation Data Bank (energy services and general industry); and |
| | | ii. | 23 peer companies representing the utility and energy industry. |
The 23 peer companies ranged in annual revenue size from approximately $760$620 million to $4.5$4.7 billion with the median at $1.6 billion. These are the same companies the Committee chose for our peer group for our 2015 to 2017 Performance Share Plan. The survey data werewas adjusted for our relative revenue size increasing from $1.3 billion in 2015 to $1.6 billion in 2016, post the SourceGas acquisition using regression analysis. Our peer companies included in the analysis for 20152016 compensation decisions were:
| | | | Alliant Energy Corp | MDU Resources Group, Inc. | Portland General Electric Co. | | ALLETE Inc. | MGE Energy Inc. | Questar Corporation | Avista CorpAlliant Energy Corporation | National Fuel Gas Co. | Southwest Gas CorpCorporation | | Avista Corp. | Northwest Natural Gas Co. | Spire, Inc. | | Cleco Corporation | Northwest Natural Gas Co.NorthWestern Corp. | UIL Holdings Corporation | | El Paso Electric Co. | Northwestern CorpOGE Energy Corp. | Vectren Corporation | Great Plains Energy, IncorporatedInc. | OGE Energy Corp.Piedmont Natural Gas | Westar Energy Inc. | | IDACORP Inc. | Piedmont Natural GasPNM Resources, Inc. | WGL Holdings Inc. | The LacledeMDU Resources Group, Inc. | PNM Resources, Inc.Portland General Electric Co. | |
The salary surveys are one of several factors the Committee uses in setting appropriate compensation levels. Other factors include company performance, individual performance and experience, the level and nature of the executive’s responsibilities, internal equity considerations and discussions with the CEO related to the other senior executive officers.
Components of Executive Compensation
The components of our executive compensation program consist of a base salary, a short-term incentive plan, and long-term incentives. In addition, we provide income for our officers’officers' retirement and other benefits.
An important component of the executives' total compensation is derived from incentive compensation. Incentive compensation is intended to motivate and encourage our executives to drive performance and achieve superior results for our shareholders. The Committee periodically reviews information provided by the compensation consultant to determine the appropriate level and mix of incentive compensation. Actual income in the form of incentive compensation is realized by the
executive as a result of achieving Company goals and overall stock performance. The Committee believes that a significant portion of total target compensation should be comprised of incentive compensation. In order to reward long-term growth while still encouraging short-term results, the Committee establishes incentive targets that emphasize long-term compensation at a greater level than short-term compensation.
The Committee annually reviews all components of each senior executive officer’s compensation, including salary, short-term incentive, equity and other long-term incentive compensation values granted, and the current and potential value of the executive officer’s total Black Hills Corporation equity holdings. The components of total target compensation in 2015 were as follows: | | | | | | | | | Base Salary | | Short-Term Incentive | | Long-Term Incentive | | David R. Emery, CEO | 26% | | 24% | | 50% | | Richard W. Kinzley, CFO | 44% | | 22% | | 34% | | Linden R. Evans, COO - Utilities | 38% | | 25% | | 37% | | Steven J. Helmers, Sr. V.P. - General Counsel | 45% | | 20% | | 35% | | Robert A. Myers, Sr. V.P. - Human Resources | 47% | | 21% | | 32% |
Base Salary. Base salaries for all officers are reviewed annually. We also adjust the base salary of our executives at the time of a promotion or change in job responsibility, as appropriate. Evaluation of 20152016 base salary adjustments occurred in January 2015. The Committee approved base salary increases for our Named Executive Officers averaging 3.4 percent, excluding Mr. Kinzley's salary due to his January 1, 2015 promotion to CFO.2016. The base salary component of each position was compared to the median of the market data provided by the compensation consultant. The actual base salary of each officer was determined by the executive’s performance, the experience level of the officer, the executive’s current position in a market-based salary range, and internal pay relationships. Recognizing Mr. Kinzley is a first time CFO, his base salary was targeted at the 25th percentile of the market data.
| | | | | | 2015 Base Salary | 2016 Base Salary | | | | | | Emery, CEO | $742,000 | $772,000 | | Kinzley, CFO | $330,000 | $363,000 | | Evans, COO | $465,000 | $490,000 | | Iverson, GC | $300,000 | $330,000 | | Buchholz, CIO | $290,000 | $305,000 |
Short-Term Incentive. Our Short-Term Incentive Plan is designed to recognize and reward the contributions of individual executives as well as the contributions that group performance makes to overall corporate success. The program’s goal for our corporate officers is based on earnings per share targets in order to closely align interests with shareholders and to foster teamwork and cooperation within the officer team. The short-term incentive, after applicable tax withholding, is distributed to the officer in the form of 50 percent stock and 50 percent cash, unless the officer has met his or her stock ownership guideline, in which case he or she may elect to receive the total award in cash, after deductions and applicable tax withholding. Target award levels are established as a percentage of each participant’s base salary. A target award is typically comparable to the average short-term incentive payout award of the peer group at the 50th percentile level. The actual payout will vary, based on performance, between zero and 200 percent of the individual executive’s short-term incentive target award level.
The Committee approves the target level for each officer in January, which applies to performance in the upcoming plan year. Target levels are derived in part from competitive data provided by the compensation consultant and in part by the Committee’s judgment regarding internal equity, retention and an individual executive’s expected contribution to the achievement of our strategic objectives. The target levels for the positions held by our Named Executive Officers in 2015 are shown below:
| | | | Short-term Incentive Target | | | | | | | Short-Term Incentive Target | | | 2015 | 2016 | | | % Amount | $ Amount | % Amount | $ Amount | | Emery, CEO | 90% | $667,800 | 100% | $772,000 | | Kinzley, CFO | 50% | $165,000 | 60% | $217,800 | | Evans, COO | 65% | $302,250 | 65% | $318,500 | | Iverson, GC | 45% | $135,000 | 45% | $148,500 | | Buchholz, CIO | 45% | $130,500 | 45% | $137,250 |
(Percentage of Base Salary)
| David R. Emery, CEO | 90% | Richard W. Kinzley, CFO | 50% | Linden R. Evans, COO - Utilities | 65% | Steven J. Helmers, Sr. V.P. - General Counsel | 45% | Robert A. Myers, Sr. V.P. - Human Resources | 45% |
The threshold, target and maximum payout levels for our Named Executive Officers under the 20152016 Short-Term Incentive Plan are shown in the Grants of Plan Based Awards in 20152016 table on page 33,40, under the heading “Estimated Future Payouts Under Non-Equity Incentive Plan Awards.”
Early in the first quarter, the Committee meets to establish the goals for the current plan year, to evaluate actual performance in relation to the prior year’s targets and to approve the actual payment of awards related to the prior plan year. The Committee reserves the discretion to adjust any award, and will review and take into account individual performance, level of contribution, and the accomplishment of specific project goals that were initiated throughout the plan year.
The Committee selected an earnings per share goal based on ongoing operations, as adjusted, for 2015.2016. This meets the objectives of the plan, including: aligns the interests of the plan participants and the shareholders with a corporate-wide component; | | | | | | | Aligns the interests of the plan participants and the shareholders with a corporate-wide component |
motivates employees and supports the corporate compensation philosophy;provides an incentive reflective of core operating performance by adjusting for unique one-time events; | | | | | | | Motivates employees and supports the corporate compensation philosophy |
easily understood and communicated to ensure “buy-in” from the participants; andmeets the performance objectives of the plan, to achieve over time, an average payout equal to market competitive levels. | | | | | | | Provides an incentive reflective of core operating performance by adjusting for unique one-time events |
| | | | | | | Easily understood and communicated to ensure “buy-in” from the participants |
| | | | | | | Meets the performance objectives of the plan, to achieve over time, an average payout equal to market competitive levels |
The Committee has defined earnings per share from ongoing operations, as adjusted, to be actualGAAP earnings per share adjusted for unrealized gains or losses on interest rate swaps, unique one-time non-budgeted events (similar to those items adjusted for when reporting non-GAAP earnings for external purposes), including external acquisition costs, non-cash oil and gas ceiling test impairments, andtransaction financing transactions costs, unrealized gains or losses on interest rate swaps, and other items the Committee deems not reflective of ongoing operations and the value created for shareholders. In setting the 2016 goals, the Committee took into consideration the full year impact on earnings from financing the SourceGas transaction with only a partial year of operations contributing.
The Committee approved the goals for 20152016 for the corporate officers as follows: | | | Threshold | | Earnings Per Share from Ongoing Operations, as Adjusted | | Payout % of Target | | Earnings Per Share from Ongoing Operations, as Adjusted | | Payout % of Target | | Minimum | | $2.70 | | 50% | | $2.69 | | 50% | | Target | | $3.00 | | 100% | | $2.99 | | 100% | | Maximum | | $3.30 | | 200% | | $3.29 | | 200% |
On January 26, 2016,24, 2017, the Committee approved a payout of 92166 percent of target under the 20152016 Short-Term Incentive Plan based on the attainment of $2.95$3.19 earnings per share from ongoing operations, as adjusted, for incentive plan purposes.adjusted. Earnings from ongoing operations, as adjusted, for incentive plan purposes were calculated by adjusting Earningsthe same as earnings per share, from continuing operations, as adjusted, of $2.98 per share, reported externally to our investors (and reconciled to GAAP Earningsearnings per Shareshare in Appendix A), for two special items, as shown below:. For 2016, the actual adjustments included impairment charges and acquisition costs.
| | | | | | | | | Earnings per share from continuing operations, as adjusted | $ | 2.98 |
| | Adjustments for special items: | | | Remove benefit of lower depletion expense as a result of ceiling test impairments | (0.07 | ) | Effect of November 23rd equity issuance for financing the Source Gas acquisition | 0.04 |
| | Earnings per share from ongoing operations, as adjusted, for incentive plan purposes | $ | 2.95 |
|
The Committee deemed the two above adjustments were appropriate. The non-cash oil and gas ceiling test impairments were excluded from earnings per share from continuing operations, as adjusted, therefore it was deemed appropriate to remove the benefit of the lower depletion expense as a result of the ceiling test impairments. The November 23rd equity issuances were necessary to provide financing for the SourceGas acquisition which closed in February 2016. Because this was a strategic acquisition for the Company, not known at the time the 2015 budget was prepared and target goals set, and no SourceGas operations were included in 2015 earnings, it was deemed appropriate to add back the dilution impact of the equity issuances. The net impact of the two adjustments was a decrease in the payout to executive officers.
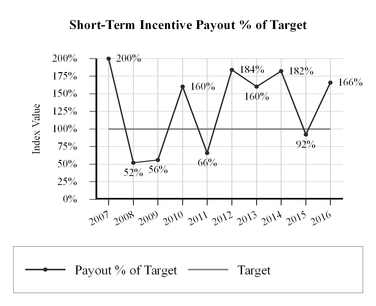
The 2015 award, after applicable tax withholding, was distributed in the form of 50 percent stock and 50 percent cash to Mr. Kinzley. Messrs. Emery, Evans, Helmers and Myers had met their stock ownership guidelines and elected to receive their 2015 award in the form of 100 percent cash. Payouts for corporate officers under the Short-Term Incentive Plan have varied over the last five10 years as shown below:in the graph below.
| | | | | | | Plan Year | | Payout % of Target | | 2015 | | 92 | % | | | 2014 | | 182 | % | | | 2013 | | 160 | % | | | 2012 | | 184 | % | | | 2011 | | 66 | % | |
Actual awards made to each of our Named Executive Officers under the Short-Term Incentive Plans for 20152016 are included in the Non-Equity Incentive Plan Compensation column of the Summary Compensation Table on page 31.38.
Long-Term Incentive. Long-term incentive compensation is comprised of grants made by the Committee under our 2005 Omnibus Incentive Plan for incentives granted prior to April 28, 2015, and our 2015 Omnibus Incentive Plan for incentives granted subsequent to April 28, 2015 (“Omnibus Incentive Plans”). Both plans were previously approved by our shareholders.Plan. Long-term incentive compensation is intended to: promote corporate goals by linking the personal interests of participants to those of our shareholders; | | | | | | | Promote corporate goals by linking the personal interests of participants to those of our shareholders |
provide participants with an incentive for excellence in individual performance;promote teamwork among participants; and | | | | | | | Provide participants with an incentive for excellence in individual performance |
motivate, retain, and attract the services of participants who make significant contributions to our success by allowing participants to share in such success. | | | | | | | Promote teamwork among participants |
| | | | | | | Motivate, retain, and attract the services of participants who make significant contributions to our success by allowing participants to share in such success |
| | | | | | | Meets the performance objectives of the plan, to achieve over time, an average payout equal to market competitive levels |
The Committee oversees the administration of the Omnibus Incentive Plans with full power and authority to determine when and to whom awards will be granted, along with the type, amount and other terms and conditions of each award. The long-term incentive compensation component is currently composed of performance shares and restricted stock (or restricted stock units if the executive elects to defer the compensation) and performance shares.. The Committee chose these components because linking executive compensation to stock price appreciation and total shareholder return is an effective way to align the interests of management with those of our shareholders. The Committee selected total shareholder return as the performance goal for the performance shares because it believes executive pay under a long-term, capital accumulation program should mirror our performance in shareholder return as compared to our peer group of companies.
The value of long-term incentives awarded is based primarily on competitive market-based data presented by the compensation consultant to the Committee, the impact each position has on our shareholder return and internal pay relationships. The actual amount realized will vary from the awarded target amounts. The Committee approved the target long-term incentive compensation level for each officer in January 2015.2016.
Long-term incentive compensation approved for 2015 for our Named Executive Officers is shown in the table below:
| | | | | | | | | | | Long-Term Incentive Value | | Percentage of Base Salary | | David R. Emery, CEO | $ | 1,400,000 |
| | 189 | % | | | Richard W. Kinzley, CFO | $ | 250,000 |
| | 76 | % | | | Linden R. Evans, COO - Utilities | $ | 450,000 |
| | 97 | % | | | Steven J. Helmers, Sr. V.P. - General Counsel | $ | 280,000 |
| | 79 | % | | | Robert A. Myers, Sr. V.P. - Human Resources | $ | 225,000 |
| | 68 | % | |
| | | | | NEO Long-Term Incentive Target Compensation | | | 2015 | 2016 | | Emery, CEO | $1,400,000 | $1,600,000 | | Kinzley, CFO | $250,000 | $300,000 | | Evans, COO | $450,000 | $500,000 | | Iverson, GC | $220,000 | $260,000 | | Buchholz, CIO | $200,000 | $210,000 |
| | | | | | | | 2016 NEO Long-Term Incentive Compensation as a Percentage of Base Salary | | | Emery, CEO | Kinzley, CFO | Evans, COO | Iverson, GC | Buchholz, CIO | | % of Base Salary | 207% | 83% | 102% | 79% | 69% |
The variance in percentage of base salary for the long-term incentive value of our Named Executive Officers reflects our philosophy that certain officers should have more of their total compensation at risk because they hold positions that have a greater impact on our long-term results. Mr. Kinzley's long-term incentive as a percentage of base salaryresults and is lower than what is typically seen for a CFO due to his transitioning as a new CFO.also consistent with market practice.
Restricted stock (or restricted stock units) isPerformance shares are used to deliver 50 percent of the long-term incentive award amounts, with the remaining 50 percent delivered in the form of performance shares.restricted stock (or restricted stock units). The actual shares of performance shares and restricted stock and performance shares granted in 20152016 are reflected in the tables in the Performance Shares andRestricted Stock and Restricted Stock Units and Performance Shares sections that follow.
Performance Shares. Participants are awarded a target number of performance shares based upon the value of the individual performance share component approved by the Committee, divided by the Beginning Stock Price. The Beginning Stock Price, as defined under the Performance Plan, is the average of the closing price of our common stock for the 20 trading days immediately preceding the beginning of the plan period. Entitlement to performance shares is based on our total shareholder return over designated performance periods, as measured against our peer group. The final value of the performance shares is based upon the number of shares of common stock that are ultimately granted, based upon our performance in relation to the performance criteria.
The Committee, with the guidance of Willis Towers Watson, periodically conducts a review of the market competitiveness of our Performance Share Plan. It was determined that the performance criteria range needed to be modified to align us with our peer group. To provide a balanced range adjustment, the Committee increased the maximum performance level required for payout from the 85th percentile to the 90th percentile and lowered the threshold performance level required for payout from the 30th percentile to the 25th percentile. A summary of the performance criteria for each plan period is summarized in the tables below.
| | | | | | 2016-2018 Performance Share Plan | | Percentile Ranking for Threshold Payout of 25% of Target Shares | Percentile Ranking for Target Payout of 100% of Target Shares | Percentile Ranking for Maximum Payout Level | Possible Payout Range of Target | | | | | 25th percentile | 50th percentile | 90th percentile | 0-200% |
| | | | | | 2014-2016 and 2015-2017 Performance Share Plans | | Percentile Ranking for Threshold Payout of 50% of Target Shares | Percentile Ranking for Target Payout of 100% of Target Shares | Percentile Ranking for Maximum Payout Level | Possible Payout Range of Target | | | | | 30th percentile | 50th percentile | 85th percentile | 0-200% |
The performance awards and dividend equivalents, if earned, are paid in 50 percent cash and 50 percent common stock. All payroll deductions and applicable tax withholding related to the award are withheld from the cash portion. Performance share target grant values for new performance periods are approved in January of each year.
Due to the merger and acquisition activity in our peer group in 2016, with the guidance of Willis Towers Watson, we conducted a review of our peer group and revised the group to ensure it consisted of appropriate companies to which we should be compared that are operationally similar. As a result of the large increase in the relative size of our utilities resulting from the acquisition of SourceGas, the Committee chose to remove those companies whose revenue mix was less than 85 percent from utilities. They also added seven new utility companies with revenue from .4x - 2.5x a projected $2.0 billion revenue and market capitalization from .25x - 4.0x our $2.6 billion market capitalization at the time of the study. The new peer group chosen for the 2016 to 2018 performance plan and 2017 compensation benchmarking is comprised of the following companies:
| | | | | ALLETE Inc. | MGE Energy Inc. | Pinnacle Wester Capital Corp. | | Alliant Energy Corporation | New Jersey Resources Corp. | PNM Resources, Inc. | | Ameren Corporation | NiSource, Inc. | Portland Resources Inc. | | Avista Corp. | Northwest Natural Gas Co. | South Jersey Industries | | CMS Energy | NorthWestern Corp. | Spire, Inc. | | El Paso Electric Co. | OGE Energy Corp. | Westar Energy Inc. | | Great Plains Energy, Inc. | ONE Gas, Inc. | WGL Holdings Inc. | | IDACORP Inc. | | |
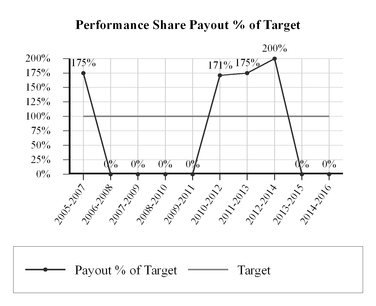
Payouts under the Performance Share Plan have varied over the last 10 years as shown in the graph below. Each performance share period extends for three years. For the recently completed performance period, January 1, 2014 to December 31, 2016, our total shareholder return was 28 percent, which ranked below the threshold 30th percentile of our peer group, resulting in no payout.
Target shares for each of our Named Executive Officers for the outstanding performance periods are as follows: | | | | | | | | | | | | | January 1, 2015 to December 31, 2017 Performance Period | | January 1, 2016 to December 31, 2018 Performance Period | | Emery, CEO | | 13,205 |
| | | 18,349 |
| | | Kinzley, CFO | | 2,358 |
| | | 3,440 |
| | | Evans, COO | | 4,244 |
| | | 5,734 |
| | | Iverson, GC | | 2,075 |
| | | 2,982 |
| | | Buchholz, CIO | | 1,886 |
| | | 2,408 |
| |
Actual payouts, if any, will be determined based upon our total shareholder return for the plan period in comparison to our peer group.
Restricted Stock and Restricted Stock Units. Restricted stock and restricted stock units awarded as long-term incentives vest one-third each year over a three-year period, and automatically vest in their entirety upon death, disability or a change in control. Dividends are paid on the restricted stock and dividend equivalents accrue on restricted stock units. Unvested restricted stock or units are forfeited if an officer’s employment is terminated for any reason other than death, disability or in the event of a change in control. Corporate officers may elect to receive the award in the form of restricted stock, or to defer the payment under the Nonqualified Deferred Compensation Plan in the form of restricted stock units.
The year 2016 was a transformational year for us with the acquisition of SourceGas. As a special recognition of the key contributions each officer made to successfully prepare for and close this transaction in only seven months, the Committee also awarded special achievement awards to the officers, taking into account each individual officer's involvement with and contribution to the transaction in the form of restricted stock that vests ratably over three years.
The number of shares of restricted stock awarded in 20152016 for each of our Named Executive Officers is shown below and is included in the Grants of Plan Based Awards in 20152016 table under the heading “All Other Stock Awards: Number of Shares of Stock or Units” and “Grant Date Fair Value of Stock Awards” on page 33.40.
| | | | | | Shares of
Restricted Stock Granted
| David R. Emery, CEO | 13,872 |
| | Richard W. Kinzley, CFO | 2,477 |
| | Linden R. Evans, COO - Utilities | 4,459 |
| | Steven J. Helmers. Sr. V.P. - General Counsel | 2,774 |
| | Robert A. Myers, Sr. V.P. - Human Resources | 2,229 |
| |
Performance Shares. Participants are awarded a target number of performance shares based upon the value of the individual performance share component approved by the Committee, divided by the Beginning Stock Price. The Beginning Stock Price, as defined under the Performance Plan, is the average of the closing price of our common stock for the 20 trading days immediately preceding the beginning of the plan period. Entitlement to performance shares is based on our total shareholder return over designated performance periods, as measured against our peer group. In addition, in order for any performance shares to be awarded, the Ending Stock Price (20-day average) must be at least equal to 75 percent of the Beginning Stock Price. The final value of the performance shares is based upon the number of shares of common stock that are ultimately granted, based upon our performance in relation to the performance criteria.
The Committee, with the guidance of Willis Towers Watson, periodically conducts a review of the market competitiveness of our Performance Share Plan. A summary of the performance criteria for each performance period outstanding as of December 31, 2015 is summarized in the table below.
| | | | | Percentile Ranking for Threshold Payout of 50% of Target Shares | Percentile Ranking for Threshold Payout of 100% of Target Shares | Percentile Ranking for Maximum Payout Level | Possible Payout Range of Target | | | | | 30th percentile
| 50th percentile
| 85th percentile
| 0-200% |
The performance awards and dividend equivalents, if earned, are paid in 50 percent cash and 50 percent common stock. All payroll deductions and applicable tax withholding related to the award are withheld from the cash portion. Performance share target grant values for new performance periods are approved in January of each year.
In 2015, with the guidance of Willis Towers Watson, we conducted a review of our peer group to ensure it consisted of appropriate companies to which we should be compared. The review resulted in our peer group going from 18 to 23 companies. The new peer group and the peer group for the January 1, 2015 to December 31, 2017 Performance Period is the same peer group identified on page 22 that we used for 2015 compensation decisions.
Our peer group for the January 1, 2013 to December 31, 2015 and January 1, 2014 to December 31, 2016 Performance Periods is comprised of the following companies:
| | | | Alliant Energy Corp | MDU Resources Group, Inc. | Portland General Electric Co. | ALLETE Inc. | National Fuel Gas Co. | Questar Corp. | Avista Corp | NorthWestern Corporation | Southwest Gas Corp. | CH Energy Group Inc. | NV Energy, Inc. | UIL Holdings Corp. | Cleco Corporation | OGE Energy Corp. | UniSource Energy Corp. | Great Plains Energy Incorporated | Piedmont Natural Gas | Vectren Corporation | IDACORP, Inc. | PNM Resources, Inc. | Westar Energy Inc. |
(Cleco Corporation, Piedmont Natural Gas, Questar Corp. and UIL Holdings Corp. have announced plans to be acquired by other companies. Upon closing of each acquisition, the respective company will be removed from our peer group for incentive plan purposes.)
Each performance share period extends for three years. For the recently completed performance period, January 1, 2013 to December 31, 2015, our total shareholder return was 34 percent, which ranked below the threshold 30th percentile of our peer group, resulting in no payout.
Payouts under the Performance Share Plan have varied over the last five years, as shown below:
| | | | | | Performance Period | | Payout % of Target | | January 1, 2013 to December 31, 2015 | | 0% | | | January 1, 2012 to December 31, 2014 | | 200% | | | January 1, 2011 to December 31, 2013 | | 175% | | | January 1, 2010 to December 31, 2012 | | 171% | | | January 1, 2009 to December 31, 2011 | | 0% | | |
Target shares for each of our Named Executive Officers for the outstanding performance periods are as follows:
| | | | | | | | | | | | | January 1, 2014 to December 31, 2016 Performance Period | | January 1, 2015 to December 31, 2017 Performance Period | | David R. Emery, CEO | | 12,648 |
| | | 13,205 |
| | | Richard W. Kinzley, CFO | | 1,703 |
| | | 2,358 |
| | | Linden R. Evans, COO - Utilities | | 3,940 |
| | | 4,244 |
| | | Steven J. Helmers. Sr. V.P. - General Counsel | | 2,676 |
| | | 2,641 |
| | | Robert A. Myers, Sr. V.P. - Human Resources | | 2,189 |
| | | 2,122 |
| |
Actual payouts, if any, will be determined based upon our total shareholder return for the plan period in comparison to our peer group. | | | | | | Long Term Incentive | Special Achievement Award | | Emery, CEO | 15,625 | 4,883 | | Kinzley, CFO | 2,930 | 3,906 | | Evans, COO | 4,883 | 4,883 | | Iverson, GC | 2,539 | 2,930 | | Buchholz, CIO | 2,051 | 2,930 |
Performance Evaluation
Role of Executive Officers in Compensation Decisions. The CEO annually reviews the performance of each of our executive officers. Based upon these performance reviews, market analysis conducted by compensation consultants and discussions with our Sr. V.P. -Senior Vice President and Chief Human Resources Officer, the CEO recommends the compensation for this group of officers to the Committee.
Role of the Committee and Board in Setting Executive Compensation. The Committee reviews and establishes the Company’s financial targets and the CEO’s goals and objectives for the year. After the end of each year, the Committee evaluates the CEO’s performance in light of established goals and objectives, with input from the other independent directors. Based upon the Committee’s evaluation and recommendation, the independent directors of the Board set the CEO’s annual compensation, including salary, short-term incentive, long-term incentive and equity compensation.
The Committee reviews the CEO’s recommended compensation levels for our senior officers. The Committee may approve the CEO’s compensation recommendations for this group of officers or exercise its discretion in modifying any of the recommended compensation and award levels in its review and approval process. The Committee is required to approve all decisions regarding equity awards to our officers.
Stock Ownership GuidelinesSTOCK OWNERSHIP GUIDELINES
The Committee has implemented stock ownership guidelines that apply to all officers based upon their level of responsibility. We believe it is important for our officers to hold a significant amount of our common stock to further align their performance with the interest of our shareholders. A “retention ratio” approach to stock ownership is incorporated into the guidelines. Officers are required to retain 100 percent of all shares owned, including shares awarded through our incentive plans (net of share withholding for taxes and, in the case of cashless stock option exercises, net of the exercise price and withholding for taxes) until specific ownership goals are achieved. Ownership guidelines are denominated in share amounts that approximateamounts. Assuming a multiple of$60 stock price, the ownership guideline is 7x base salary.pay for the CEO, 6x for the CFO and 4.5-5.0x for the other executive officers.
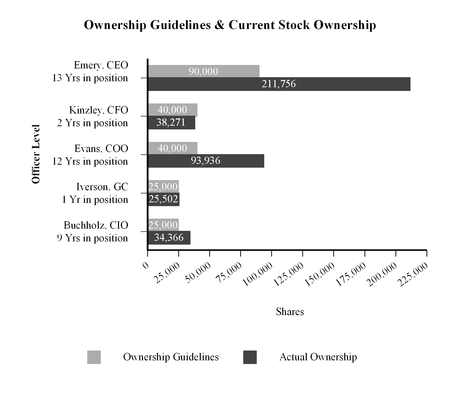
The ownership guidelines and current stock ownership of our Named Executive Officers as of March 1, 2016,2017, are shown below: | | | | | | | | | |
Officer Level | | Ownership Guideline (# of Shares) | | Actual Ownership (# of Shares) | | Years in Position | | David R. Emery, CEO | | 90,000 | | 200,510 | | | 12 | | | Richard W. Kinzley, CFO | | 40,000 | | 33,614 | | | 1 | | | Linden R. Evans, COO - Utilities | | 40,000 | | 93,784 | | | 11 | | | Steven J. Helmers. Sr. V.P. - General Counsel | | 25,000 | | 61,485 | | | 15 | | | Robert A. Myers, Sr. V.P. - Human Resources | | 25,000 | | 33,758 | | | 7 | |
2015 Benefits2016 BENEFITS
Retirement Benefits. We maintain a variety of employee benefit plans and programs in which our executive officers may participate. We believe it is important to provide post-employment benefits to our executive officers and the benefits we provide approximate retirement benefits paid by other employers to executives in similar positions. The Committee periodically reviews the benefits provided, with assistance from its compensation consultant, to maintain a market-based benefits package. None of our Named Executive Officers received any pension benefit payments in 2015.2016.
Effective January 1, 2010,Several years ago, we adopted a defined contribution plan design as our primary retirement plan and amended our Defined Benefit Pension Plan (“Pension Plan”) for all eligible employees to incorporate a partial freeze in which the accrual of benefits ceased for certain participants while other participants were allowed an election to continue to accrue benefits. Mr.Messrs. Emery isand Buchholz are our only Named Executive OfficerOfficers who met the age and service requirement allowing himthem to continue to accrue benefits under the Pension Plan. Employees whom no longer accrue benefits under the Pension Plan now receive Company Retirement Contributions (“Retirement Contributions”) in the Retirement Savings Plan. The Retirement Contributions are an age and service points-based calculation.
The 401(k) Retirement Savings Plan is offered to all our eligible employees and we provide matching contributions for certain eligible participants. All of our Named Executive Officers are participants in the 401(k) Retirement Savings Plan and
received matching contributions in 2015.2016. The matching contributions and the Retirement Contributions are included as “All Other Compensation” in the Summary Compensation Table on page 31.38.
We also provide Nonqualified Plans to certain officers because of Internal Revenue Code limitations imposed on the qualified plans. The level of retirement benefits provided by the Pension Plan and Nonqualified Plans for each of our Named Executive Officers is reflected in the Pension Benefits for 20152016 table on page 36.43. Our contributions to the Nonqualified Deferred Compensation Plan are included in the All Other Compensation column of the Summary Compensation Table on page 3138 and the aggregate Nonqualified Deferred Compensation balance at December 31, 20152016 is reported in the Nonqualified Deferred Compensation for 20152016 table on page 39.46. These retirement benefits are explained in more detail in the accompanying narrative to the tables.
Other Personal Benefits. We provide the personal use of a Company vehicle, executive health services, and limited reimbursement of financial planning services as benefits to our executive officers. The specific amount attributable to these benefits in 20152016 is disclosed in the Summary Compensation Table on page 31.38. The Committee periodically reviews the other personal benefits provided to our executive officers and believes the current benefits are reasonable and consistent with our overall compensation program.
Change in Control PaymentsCHANGE IN CONTROL PAYMENTS
Our Named Executive Officers may also receive severance benefits in the event of a change in control. We have no employment agreements with our Named Executive Officers. However, change in control agreements are common among our peer group and the Committee and our Board of Directors believe providing these agreements to our corporate officers protects our shareholder interests in the event of a change in control by helping assure management focus and continuity. Our change in control agreements have expiration dates and our Board of Directors conducts a thorough review of the change in control agreements at each renewal period. Our current changeThe Board conducted a review of the agreements in control2016 and entered into new agreements expirewith senior executive officers replacing the agreements that expired on November 15, 2016. The new agreements are substantially the same as the prior agreements with an expiration date of November 15, 2019. In general, our change in control agreements provide a severance payment of up to 2.99 times average compensation for our CEO, and up to two times average compensation for the other Named Executive Officers. The change in control agreements do not provide for excise tax gross-ups and contain a “double trigger,” providing benefits in association with: | | | | | (1) | a change in control, and | | (2) | (i) | a termination of employment other than by death, disability or by us for cause, or | | | (ii) | a termination by the employee for good reason. |
See the Potential Payments upon Termination or Change in Control table on page 4148 and the accompanying narrative for more information regarding our change in control agreements and estimated payments associated with a change in control.
Tax and Accounting ImplicationsTAX AND ACCOUNTING IMPLICATIONS
Section 162(m) of the U.S. Internal Revenue Code of 1986, as amended, limits the tax deductibility by a corporation of compensation in excess of $1 million paid to certain of its officers. Compensation which qualifies as “performance-based” is excluded from the $1 million limit, if, among other requirements, the compensation is payable only upon attainment of pre-
established,pre-established, objective performance goals under a plan approved by the corporation’s shareholders. Our 2015 Omnibus Incentive Plan is structured so that short-term and long-term, cash and equity awards granted under the plans may qualify as performance based compensation. The Compensation Committee generally manages a large share of our incentive compensation for our Named Executive Officers to qualify for the “performance-based” exemption. However, the Compensation Committee has the discretion to design and use compensation elements and awards that may not be deductible under Section 162(m) if it determines those elements are in line with competitive practice, our compensation philosophy, and our best interests.
Clawback PolicyCLAWBACK POLICY
We have a policy that if an accounting restatement occurs after incentive payments have been made, due to the results of misconduct associated with financial reporting, the Committee will seek repayment of the incentive compensation from our CEO and CFO, and the Committee has the discretion to request repayment of incentive compensation from our other officers, taking into consideration the individual roles and responsibilities prompting the restatement.
In addition, our award agreements for restricted stock and target performance shares include clawback provisions whereby the participant may be required to repay all income or gains previously realized in respect of such awards if his or her employment is terminated for cause, or if, within one year following termination of employment, the Board determines that the participant engaged in conduct prior to his or her termination that would have constituted the basis for a termination of employment for cause.
REPORT OF THE COMPENSATION COMMITTEE REPORT
The Compensation Committee has reviewed and discussed the Compensation Discussion and Analysis required by Item 402(b) of Regulation S-K with management and, based on such review and discussions, the Compensation Committee recommended to our Board of Directors that the Compensation Discussion and Analysis be included in this proxy statement.
THE COMPENSATION COMMITTEE
Michael H. Madison, Chair Jack W. Eugster
Linda K. Massman Rebecca B. Roberts Teresa A. Taylor Thomas J. Zeller
SUMMARY COMPENSATION TABLE
The following table sets forth the total compensation paid or earned by each of our Named Executive Officers for the years ended December 31, 2016, 2015, 2014 and 2013.2014. We have no employment agreements with our Named Executive Officers.
| | | | | | | | | | | | | | | | | | | | | Name and Principal Position | Year | Salary | Stock Awards(2) | Non-Equity Incentive Plan Compensation(3) | Changes in Pension Value and Nonqualified Deferred Compensation Earnings (4) | All Other Compensation(5) | Total | | David R. Emery | 2015 |
| $738,333 |
|
| $1,425,200 |
|
| $613,241 |
|
| $1,283,749 |
|
| $70,979 |
|
| $4,131,502 |
| | Chairman, President and Chief Executive Officer | 2014 |
| $715,500 |
|
| $1,347,931 |
|
| $1,177,092 |
|
| $2,782,449 |
|
| $63,661 |
|
| $6,086,633 |
| | 2013 |
| $689,650 |
|
| $1,037,511 |
|
| $996,155 |
|
| $— |
|
| $64,294 |
|
| $2,787,610 |
| Richard W. Kinzley(1) | 2015 |
| $326,241 |
|
| $254,490 |
|
| $151,520 |
|
| $— |
|
| $160,404 |
|
| $892,655 |
| | Sr. Vice President and Chief Financial Officer | |
|
|
|
|
|
| |
|
|
|
| | |
|
|
|
|
|
|
|
|
|
|
|
| | Linden R. Evans | 2015 |
| $462,833 |
|
| $458,081 |
|
| $277,556 |
|
| $— |
|
| $356,843 |
|
| $1,555,313 |
| | Chief Operating Officer – Utilities | 2014 |
| $448,500 |
|
| $419,911 |
|
| $533,688 |
|
| $113,452 |
|
| $305,840 |
|
| $1,821,391 |
| | 2013 |
| $428,481 |
|
| $399,050 |
|
| $446,992 |
|
| $— |
|
| $308,013 |
|
| $1,582,536 |
| | Steven J. Helmers | 2015 |
| $351,500 |
|
| $285,020 |
|
| $146,698 |
|
| $176,119 |
|
| $139,826 |
|
| $1,099,163 |
| | Sr. Vice President – General Counsel | 2014 |
| $331,333 |
|
| $285,178 |
|
| $272,775 |
|
| $404,197 |
|
| $121,391 |
|
| $1,414,874 |
| | 2013 |
| $316,300 |
|
| $269,349 |
|
| $228,444 |
|
| $— |
|
| $112,303 |
|
| $926,396 |
| | Robert A. Myers | 2015 |
| $328,833 |
|
| $229,015 |
|
| $136,368 |
|
| $— |
|
| $175,427 |
|
| $869,643 |
| | Sr. Vice President – Human Resources | 2014 |
| $321,500 |
|
| $233,278 |
|
| $234,764 |
|
| $— |
|
| $195,545 |
|
| $985,087 |
| | 2013 |
| $312,219 |
|
| $219,468 |
|
| $200,442 |
|
| $— |
|
| $192,092 |
|
| $924,221 |
|
| | | | | | | | | | | | | | | | | | | Name and Principal Position | Year | Salary | Stock Awards(2) | Non-Equity Incentive Plan Compensation(3) | Changes in Pension Value and Nonqualified Deferred Compensation Earnings (4) | All Other Compensation(5) | Total | | David R. Emery | 2016 | $767,000 |
| $1,926,358 |
|
| $1,283,218 |
|
| $1,061,157 |
|
| $104,751 |
|
| $5,142,484 |
| | Chairman and Chief Executive Officer | 2015 | $738,333 |
| $1,425,200 |
|
| $613,241 |
|
| $1,283,749 |
|
| $70,979 |
|
| $4,131,502 |
| | 2014 | $715,500 |
| $1,347,931 |
|
| $1,177,092 |
|
| $2,782,449 |
|
| $63,661 |
|
| $6,086,633 |
| | Richard W. Kinzley | 2016 | $357,500 |
| $514,297 |
|
| $362,027 |
|
| $23,493 |
|
| $174,154 |
|
| $1,431,471 |
| | Sr. Vice President and Chief Financial Officer | 2015 | $326,241 |
| $254,490 |
|
| $151,520 |
|
| $— |
|
| $160,404 |
|
| $892,655 |
| | |
|
|
|
|
|
|
|
|
|
|
| Linden R. Evans(1) | 2016 | $485,833 |
| $773,875 |
|
| $529,411 |
|
| $37,711 |
|
| $299,611 |
|
| $2,126,441 |
| | President and Chief Operating Officer | 2015 | $462,833 |
| $458,081 |
|
| $277,556 |
|
| $— |
|
| $356,843 |
|
| $1,555,313 |
| | 2014 | $448,500 |
| $419,911 |
|
| $533,688 |
|
| $113,452 |
|
| $305,840 |
|
| $1,821,391 |
| Brian G. Iverson(1) | 2016 | $325,000 |
| $422,433 |
|
| $246,837 |
|
| $11,890 |
|
| $111,429 |
|
| $1,117,589 |
| | Sr. Vice President and General Counsel | |
|
|
|
|
| |
|
|
|
| | |
|
|
|
|
|
|
|
|
|
|
| | Scott A. Buchholz | 2016 | $302,500 |
| $370,033 |
|
| $228,137 |
|
| $366,662 |
|
| $112,969 |
|
| $1,380,301 |
| | Sr. Vice President and Chief Information Officer | | | | | | | | | | | | | | | |
| | | (1) | Mr. KinzleyEvans was named President and Chief Operating Office effective January 1, 2016. Previously he was Chief Operating Officer of the Utilities. Mr. Iverson was named Sr. Vice President and Chief Financial OfficerGeneral Counsel effective January 1, 2015.April 25, 2016. Previously he was Sr. Vice President - Regulatory and Government Affairs and Assistant General Counsel. |
| | | (2) | Stock Awards represent the grant date fair value related to restricted stock and performance shares that have been granted as a component of long-term incentive compensation.compensation and the 2016 special achievement awards. The grant date fair value is computed in accordance with the provisions of accounting standards for stock compensation. Assumptions used in the calculation of these amounts are included in Note 12 of the Notes to the Consolidated Financial Statements in our Annual Report on Form 10-K for the year ended December 31, 2015.2016. |
| | | (3) | Non-Equity Incentive Plan Compensation represents amounts earned under the Short-Term Incentive Plan. The Compensation Committee approved the payout of the 20152016 awards at its January 26, 201624, 2017 meeting, and the awards were paid on February 26, 2016.24, 2017. |
| | | (4) | Change in Pension Value and Nonqualified Deferred Compensation Earnings represents the net positive increase in actuarial value of the Pension Plan, Pension Restoration Benefit (“PRB”) and Pension Equalization Plans (“PEP”) for the respective years. These benefits have been valued using the assumptions disclosed in Note 18 of the Notes to the Consolidated Financial Statements in our Annual Report on Form 10-K for the year ended December 31, 2015.2016. Because these assumptions sometimes change between measurement dates, the change in value reflects not only the change in value due to additional benefits earned during the period and the passage of time but also reflects the change in value caused by changes in the underlying actuarial assumptions. This has created much volatility in the last three years with a large increase in values in 2014 and negative values for Messrs. Kinzley and Evans in 2015 and all Named Executive Officers in 2013. The large change in pension value for 2014 was due to implementation of new mortality tables and the change in discount rates used to calculate the present value of these benefits. A value of zero is shown in the Summary Compensation Table for certain officers in 2015 and 2013 because the SEC does not allow a negative number to be disclosed in the table. |
The Pension Plan and PRB were frozen effective January 1, 2010 for participants who did not satisfy the age 45 and 10 years of service eligibility. Messrs. Kinzley, Evans and HelmersIverson did not meet the eligibility choice criteria and their
Defined Pension and PRB benefits were frozen. Mr. Myers did not meet the one-year service requirement prior to the freeze date and, therefore, was never a participant in the Pension Plan.
The PEP is offered through the Grandfathered Pension Equalization Plan (“Grandfathered PEP”) and 2005 Pension Equalization Plan (“2005 PEP”). Messrs.Mr. Emery and Helmers are participantsis the only participant in the Grandfathered PEP and 2005 PEP. Messrs. Kinzley, Evans, Iverson and MyersBuchholz are not participants in these plans; instead they receive employer contributions into a Nonqualified Deferred Compensation Plan (“NQDC”). The NQDC employer contributions are reported in the All Other Compensation column.
No Named Executive Officer received preferential or above-market earnings on nonqualified deferred compensation. The value attributed to each Named Executive Officer from each plan is shown in the table below.
| | | | |
Year | | Defined Benefit Plan | |
PRB | | PEP | | Total Change in Pension Value | |
Year | | Defined Benefit Plan | |
PRB | | PEP | | Total Change in Pension Value | | David R. Emery | | 2015 | |
| $8,648 |
| |
| $811,077 |
| |
| $464,024 |
| |
| $1,283,749 |
| | 2016 | |
| $85,671 |
| |
| $641,790 |
| |
| $333,696 |
| |
| $1,061,157 |
| | | | 2014 | |
| $256,170 |
| |
| $1,682,510 |
| |
| $843,769 |
| |
| $2,782,449 |
| | 2015 | |
| $8,648 |
| |
| $811,077 |
| |
| $464,024 |
| |
| $1,283,749 |
| | | | 2013 | |
| ($24,853 | ) | |
| ($21,796 | ) | |
| ($78,744 | ) | |
| ($125,393 | ) | | 2014 | |
| $256,170 |
| |
| $1,682,510 |
| |
| $843,769 |
| |
| $2,782,449 |
| | Richard W. Kinzley | | 2015 | |
| ($10,498 | ) | |
| ($551 | ) | |
| $— |
| |
| ($11,049 | ) | | 2016 | |
| $22,312 |
| |
| $1,181 |
| |
| $— |
| |
| $23,493 |
| | | | | 2015 | |
| ($10,498 | ) | |
| ($551 | ) | |
| $— |
| |
| ($11,049 | ) | | Linden R. Evans | | 2015 | |
| ($8,842 | ) | |
| ($5,919 | ) | |
| $— |
| |
| ($14,761 | ) | | 2016 | |
| $22,258 |
| |
| $15,453 |
| |
| $— |
| |
| $37,711 |
| | | | 2014 | |
| $62,876 |
| |
| $50,576 |
| |
| $— |
| |
| $113,452 |
| | 2015 | |
| ($8,842 | ) | |
| ($5,919 | ) | |
| $— |
| |
| ($14,761 | ) | | | | 2013 | |
| ($16,974 | ) | |
| ($15,230 | ) | |
| $— |
| |
| ($32,204 | ) | | 2014 | |
| $62,876 |
| |
| $50,576 |
| |
| $— |
| |
| $113,452 |
| | Steven J. Helmers | | 2015 | |
| ($5,438 | ) | |
| ($2,558 | ) | |
| $184,115 |
| |
| $176,119 |
| | | | | 2014 | |
| $70,271 |
| |
| $43,744 |
| |
| $290,182 |
| |
| $404,197 |
| | | | | 2013 | |
| ($13,452 | ) | |
| ($9,599 | ) | |
| $17,301 |
| |
| ($5,750 | ) | | | Robert A. Myers | | 2015 | |
| $— |
| |
| $— |
| |
| $— |
| |
| $— |
| | | | | 2014 | |
| $— |
| |
| $— |
| |
| $— |
| |
| $— |
| | | | | 2013 | |
| $— |
| |
| $— |
| |
| $— |
| |
| $— |
| | | Brian G. Iverson | | | 2016 | |
| $11,890 |
| |
| $— |
| |
| $— |
| |
| $11,890 |
| | Scott A. Buchholz | | | 2016 | |
| $161,952 |
| |
| $204,710 |
| |
| $— |
| |
| $366,662 |
|
| | | (5) | All Other Compensation includes amounts allocated under the 401(k) match, defined contributions, NQDC contributions, dividends received on restricted stock and unvested restricted stock units and other personal benefits. Other Personal Benefits column reflects the personal use of a Company vehicle, executive health and financial planning services. |
| | | | Year | 401(k) Match | Defined Contribution | NQDC Contribution | Dividends on Restricted Stock/Units | Other Personal Benefits | Total Other Compensation | Year | 401(k) Match | Defined Contribution | NQDC Contribution | Dividends on Restricted Stock/Units | Other Personal Benefits | Total Other Compensation | | David R. Emery | 2015 |
| $15,900 |
|
| $— |
|
| $— |
|
| $42,357 |
|
| $12,722 |
|
| $70,979 |
| 2016 |
| $15,900 |
| $— | $56,695 | $32,156 | $104,751 | | Richard W. Kinzley | 2015 |
| $15,900 |
|
| $15,900 |
|
| $114,226 |
|
| $6,924 |
|
| $7,454 |
|
| $160,404 |
| 2016 |
| $15,900 |
| $15,900 | $117,736 | $15,164 | $9,454 | $174,154 | | Linden R. Evans | 2015 |
| $15,900 |
|
| $13,100 |
|
| $286,980 |
|
| $30,062 |
|
| $10,801 |
|
| $356,843 |
| 2016 |
| $15,900 |
| $13,100 | $211,972 | $40,224 | $18,415 | $299,611 | | Steven J. Helmers | 2015 |
| $15,900 |
|
| $13,100 |
|
| $93,872 |
|
| $9,035 |
|
| $7,919 |
|
| $139,826 |
| | | Robert A. Myers | 2015 |
| $14,579 |
|
| $14,421 |
|
| $124,319 |
|
| $7,321 |
|
| $14,787 |
|
| $175,427 |
| | | Brian G. Iverson | | 2016 |
| $14,638 |
| $14,362 | $57,610 | $12,405 | $12,414 | $111,429 | | Scott A. Buchholz | | 2016 |
| $14,653 |
| $— | $68,375 | $11,621 | $18,320 | $112,969 |
GRANTS OF PLAN BASED AWARDS IN 20152016(1)
| | | | | | | | | | | | | | | | | | | | | | | | | Name | Grant Date | Date of Comp-ensation Committee Action | Estimated Future Payouts Under Non-Equity Incentive Plan Awards(2) | Estimated Future Payouts Under Equity Incentive Plan Awards(3) | All Other Stock Awards: Number of Shares of Stock or Units(4) (#) | Grant Date Fair Value of Stock Awards(5) ($) | Threshold ($) | Target ($) | Maximum ($) | Threshold(#) | Target (#) | Maximum (#) | | David R. Emery | | |
| $333,900 |
|
| $667,800 |
|
| $1,335,600 |
| | | | | | | 1/27/15 | 1/27/15 | | | | 6,603 |
| 13,205 |
| 26,410 |
| |
| $725,219 |
| | 2/4/15 | 1/27/15 | | | | | | | 13,872 |
|
| $699,981 |
| | Richard W. Kinzley | | |
| $82,500 |
|
| $165,000 |
|
| $330,000 |
| | | | | | | 1/27/15 | 1/27/15 | | | | 1,179 |
| 2,358 |
| 4,716 |
| |
| $129,501 |
| | 2/4/15 | 1/27/15 | | | | | | | 2,477 |
|
| $124,989 |
| | Linden R. Evans | | |
| $151,125 |
|
| $302,250 |
|
| $604,500 |
| | | | | | | 1/27/15 | 1/27/15 | | | | 2,122 |
| 4,244 |
| 8,488 |
| |
| $233,080 |
| | 2/4/15 | 1/27/15 | | | | | | | 4,459 |
|
| $225,001 |
| | Steven J. Helmers | | |
| $79,875 |
|
| $159,750 |
|
| $319,500 |
| | | | | | | 1/27/15 | 1/27/15 | | | | 1,321 |
| 2,641 |
| 5,282 |
| |
| $145,044 |
| | 2/4/15 | 1/27/15 | | | | | | | 2,774 |
|
| $139,976 |
| | Robert A. Myers | | |
| $74,250 |
|
| $148,500 |
|
| $297,000 |
| | | | | | | 1/27/15 | 1/27/15 | | | | 1,061 |
| 2,122 |
| 4,244 |
| |
| $116,540 |
| | 2/4/15 | 1/27/15 | | | | | | | 2,229 |
|
| $112,475 |
|
| | | | | | | | | | | | | | | | | | | | | Name | Grant Date | Date of Compensation Committee Action | Estimated Future Payouts Under Non-Equity Incentive Plan Awards(2) | Estimated Future Payouts Under Equity Incentive Plan Awards(3) | All Other Stock Awards: Number of Shares of Stock or Units(4) (#) | Grant Date Fair Value of Stock Awards(5) ($) | Threshold ($) | Target ($) | Maximum ($) | Threshold (#) | Target (#) | Maximum (#) | | David R. Emery | | |
| $386,000 |
|
| $772,000 |
|
| $1,544,000 |
| | | | | | | 1/26/16 | 1/26/16 | | | | 4,587 | 18,349 | 36,698 | |
| $876,348 |
| | 2/4/16 | 1/26/16 | | | | | | | 20,508 |
| $1,050,010 |
| | Richard W. Kinzley | | |
| $108,900 |
|
| $217,800 |
|
| $435,600 |
| | | | | | | 1/26/16 | 1/26/16 | | | | 860 | 3,440 | 6,880 | |
| $164,294 |
| | 2/4/16 | 1/26/16 | | | | | | | 6,836 |
| $350,003 |
| | Linden R. Evans | | |
| $159,250 |
|
| $318,500 |
|
| $637,000 |
| | | | | | | 1/26/16 | 1/26/16 | | | | 1,434 | 5,734 | 11,468 | |
| $273,856 |
| | 2/4/16 | 1/26/16 | | | | | | | 9,766 |
| $500,019 |
| | Brian G. Iverson | | |
| $74,250 |
|
| $148,500 |
|
| $297,000 |
| | | | | | | 1/26/16 | 1/26/16 | | | | 746 | 2,982 | 5,964 | |
| $142,420 |
| | 2/4/16 | 1/26/16 | | | | | | | 5,469 |
| $280,013 |
| | Scott A. Buchholz | | |
| $68,625 |
|
| $137,250 |
|
| $274,500 |
| | | | | | | 1/26/16 | 1/26/16 | | | | 602 | 2,408 | 4,816 | |
| $115,006 |
| | 2/4/16 | 1/26/16 | | | | | | | 4,981 |
| $255,027 |
|
| | | (1) | No stock options were granted to our Named Executive Officers in 2015.2016. |
| | | (2) | The columns under “Estimated Future Payouts Under Non-Equity Incentive Plan Awards” show the range of payouts for 20152016 performance under our Short-Term Incentive Plan as described in the Compensation Discussion and Analysis under the section titled “Short-Term Incentive” on page 23.29. If the performance criteria are met, payouts can range from 50 percent of target at the threshold level to 200 percent of target at the maximum level. The 20162017 bonus payment for 20152016 performance has been made based on achieving the criteria described in the Compensation Discussion and Analysis, at 92166 percent of target, and is shown in the Summary Compensation Table on page 3138 in the column titled “Non-Equity Incentive Plan Compensation.” |
| | | (3) | The columns under “Estimated Future Payouts Under Equity Incentive Plan Awards” show the range of payouts (in shares of stock) for the January 1, 20152016 to December 31, 20172018 performance period as described in the Compensation Discussion and Analysis under the section titled “Long-Term Incentive – Performance Shares” on page 26.32. If the performance criteria are met, payouts can range from 5025 percent of target to 200 percent of target. If a participant retires, suffers a disability or dies during the performance period, the participant or the participant’s estate is entitled to that portion of the number of performance shares as such participant would have been entitled to had he or she remained employed, prorated for the number of months served. Performance shares are forfeited if employment is terminated for any other reason. During the performance period, dividends and other distributions paid with respect to the shares of common stock accrue for the benefit of the participant and are paid out at the end of the performance period. |
| | | (4) | The column “All Other Stock Awards” reflects the number of shares of restricted stock granted on February 4, 20152016 under our 20052015 Omnibus Incentive Plan.Plan, which included the Special Achievement Awards. The restricted stock vests one-third each year over a three-year period, and automatically vests upon death, disability or a change in control. Unvested restricted stock is forfeited if employment is terminated for any other reason. Dividends are paid on the restricted stock and the dividends that were paid in 20152016 are included in the column titled “All Other Compensation” in the Summary Compensation Table on page 31.38. |
| | | (5) | The column “Grant Date Fair Value of Stock Awards” reflects the grant date fair value of each equity award computed in accordance with the provisions of accounting standards for stock compensation. The grant date fair value for the performance shares was $54.92$47.76 per share and was calculated using a Monte Carlo simulation model. Assumptions used in the calculation are included in Note 12 of the Notes to the Consolidated Financial Statements in our Annual Report on Form 10-K for the year ended December 31, 2016. The grant date fair value for the restricted stock was $51.20 per share |
Form 10-K for the year ended December 31, 2015. The grant date fair value for the restricted stock was $50.46 per share for the February 4, 20152016 grant, which was the market value of our common stock on the date of grant as reported on the NYSE.
OUTSTANDING EQUITY AWARDS AT FISCAL YEAR-END 20152016(1)
| | | Name | Stock Awards | Stock Awards | Number of Shares or Units of Stock That Have Not Vested(2) (#) | Market Value of Shares or Units of Stock That Have Not Vested ($) | Equity Incentive Plan Awards: Number of Unearned Shares, Units or Other Rights That Have Not Vested(2) (#) | Equity Incentive Plan Awards: Market or Payout Value of Unearned Shares, Units or Other Rights That Have Not Vested ($) | Number of Shares or Units of Stock That Have Not Vested(2) (#) | Market Value of Shares or Units of Stock That Have Not Vested ($) | Equity Incentive Plan Awards: Number of Unearned Shares, Units or Other Rights That Have Not Vested(2) (#) | Equity Incentive Plan Awards: Market or Payout Value of Unearned Shares, Units or Other Rights That Have Not Vested ($) | | David R. Emery | 26,146 |
| | $1,213,959 | 12,927 | | $600,177 | | 33,747 |
| | $2,070,041 | 49,903 | | $3,061,050 | | | Richard W. Kinzley | 4,274 |
| | $198,442 | 2,031 | | $94,276 | | 9,026 |
| | $553,655 | 9,238 | | $566,659 | | | Linden R. Evans | 18,557 |
| | $861,602 | 4,092 | | $189,992 | | 23,943 |
| | $1,468,664 | 15,712 | | $963,774 | | | Steven J. Helmers | 5,577 |
| | $258,940 | 2,659 | | $123,434 | | | | Robert A. Myers | 4,519 |
| | $209,817 | 2,156 | | $100,080 | | | | Brian G. Iverson | | 7,384 |
| | $452,935 | 8,039 | | $493,112 | | | Scott A. Buchholz | | 6,917 |
| | $424,289 | 6,702 | | $411,101 | |
| | | (1) | There were no stock options outstanding at December 31, 20152016 for our Named Executive Officers. |
| | | (2) | Vesting dates for restricted stock and performance shares are shown in the table below. The performance shares shown with a vesting date of December 31, 2015,2016, would normally be the actual equivalent shares, including dividend equivalents, earned for the performance period ended December 31, 2015,2016, however because our total shareholder return was 3428 percent, which ranked below the threshold 30th percentile of our peer group, there was no payout. The performance shares with a vesting date of December 31, 20162017 and a vesting date of December 31, 20172018 are shown at the threshold level,target and maximum payout levels, respectively, based upon the performance as of December 31, 2015. 2016. |
| |
Name | Unvested Restricted Stock | Unvested and Unearned Performance Shares | Unvested Restricted Stock | Unvested and Unearned Performance Shares | | # of Shares | Vesting Date | # of Shares | Vesting Date | # of Shares | Vesting Date | # of Shares | Vesting Date | | David R. Emery | 4,292 | 02/04/16 | — | | 12/31/15 | 11,459 | 02/04/17 | — | | 12/31/16 | | | 4,624 | 02/04/16 | 6,324 | | 12/31/16 | | | | 3,991 | 02/10/16 | 6,603 | | 12/31/17 | | | | 4,624 | 02/04/17 | | | | | 3,991 | 02/10/17 | | | | | 4,624 | 02/04/18 | | | | David R. Emery | | 3,991 | 02/10/17 | 13,205 | | 12/31/17 | | 11,460 | 02/04/18 | 36,698 | | 12/31/18 | | 6,837 | 02/04/19 | | | | 722 | 02/04/16 | — | | 12/31/15 | 3,104 | 02/04/17 | — | | 12/31/16 | | | 825 | 02/04/16 | 852 | | 12/31/16 | | | | 537 | 02/10/16 | 1,179 | | 12/31/17 | | | | 826 | 02/04/17 | | | | | 538 | 02/10/17 | | | | | 826 | 02/04/18 | | | | Richard W. Kinzley | | 538 | 02/10/17 | 2,358 | | 12/31/17 | | 3,105 | 02/04/18 | 6,880 | | 12/31/18 | | 2,279 | 02/04/19 | | | | 1,651 | 02/04/16 | — | | 12/31/15 | 4,740 | 02/04/17 | — | | 12/31/16 | | | 1,486 | 02/04/16 | 1,970 | | 12/31/16 | | | | 1,243 | 02/10/16 | 2,122 | | 12/31/17 | | | | 1,486 | 02/04/17 | | | | | 9,960 | 02/06/17 | | | | | 1,244 | 02/10/17 | | | | | 1,487 | 02/04/18 | | | | Steven J. Helmers | 1,114 | 02/04/16 | — | | 12/31/15 | | | | 924 | 02/04/16 | 1,338 | | 12/31/16 | | | | 844 | 02/10/16 | 1,321 | | 12/31/17 | | | | 925 | 02/04/17 | | | | | 845 | 02/10/17 | | | | | 925 | 02/04/18 | | | | Robert A. Myers | 908 | 02/04/16 | — | | 12/31/15 | | | | 743 | 02/04/16 | 1,095 | | 12/31/16 | | | | 691 | 02/10/16 | 1,061 | | 12/31/17 | | | | 743 | 02/04/17 | | | | | 691 | 02/10/17 | | | | | 743 | 02/04/18 | | | | Linden R. Evans | | 9,960 | 02/06/17 | 4,244 | | 12/31/17 | | 1,244 | 02/10/17 | 11,468 | | 12/31/18 | | 4,743 | 02/04/18 | | | | 3,256 | 02/04/19 | | | | 2,549 | 02/04/17 | — | | 12/31/16 | | Brian G. Iverson | | 461 | 02/10/17 | 2,075 | | 12/31/17 | | 2,550 | 02/04/18 | 5,964 | | 12/31/18 | | 1,824 | 02/04/19 | | | | 2,320 | 02/04/17 | — | | 12/31/16 | | Scott A. Buchholz | | 614 | 02/10/17 | 1,886 | | 12/31/17 | | 2,322 | 02/04/18 | 4,816 | | 12/31/18 | | 1,661 | 02/04/19 | | |
OPTION EXERCISES AND STOCK VESTED DURING 20152016(1)
| | | Name | Stock Awards(2) | Stock Awards(2) | | Number of Shares Acquired on Vesting (#) | Value Realized on Vesting ($) | Number of Shares Acquired on Vesting (#) | Value Realized on Vesting ($) | | David R. Emery | 41,236 |
| |
| $2,154,026 |
| | 12,907 |
| |
| $668,421 |
| | | Richard W. Kinzley | 9,272 |
| |
| $482,106 |
| | 2,084 |
| |
| $107,721 |
| | | Linden R. Evans | 17,958 |
| |
| $939,545 |
| | 4,380 |
| |
| $226,618 |
| | | Steven J. Helmers | 12,127 |
| |
| $634,433 |
| | | | Robert A. Myers | 9,882 |
| |
| $517,062 |
| | | | Brian G. Iverson | | 1,702 |
| |
| $88,016 |
| | | Scott A. Buchholz | | 1,996 |
| |
| $103,362 |
| |
| | | (1) | There were no stock options exercised during 2015.2016. |
| | | (2) | Reflects only restricted stock that vested in 2015 and2016 as there was no payout of performance shares for the 2012-20142013-2015 performance period. The performance share payout was approved by the Compensation Committee on January 27, 2015 and paid out in February 2015. |
PENSION BENEFITS FOR 20152016
We made major retirement plan design changes effective January 1, 2010. WeSeveral years ago we adopted a defined contribution plan design as our primary retirement plan and amended our Pension Plan and Nonqualified Pension Plans for all eligible employees to incorporate a partial freeze in which the accrual of benefits ceased for certain participants while other participants were allowed an election to continue to accrue benefits. Employees eligible to elect continued participation were those employees who were at least 45 years old and had at least 10 years of eligible service with us as of January 1, 2010. Mr.Messrs. Emery isand Buchholz were our only Named Executive OfficerOfficers who met the age and service requirement and continuescontinue to accrue benefits under the Pension Plan and the Pension Restoration Plan. Benefits under the Pension Plan and Pension Restoration Plan were frozen for Messrs. Kinzley, Evans and Helmers. Mr. Myers did not meet the one-year service requirement prior to the freeze date and, therefore, was never a participant in the Pension Plan.Iverson. In addition, Messrs.Mr. Emery and Helmers receivereceived supplemental pension benefits under the Grandfathered Pension Equalization Plan, which was frozen effective December 31, 2004, and the 2005 Pension Equalization Plan. None of our Named Executive Officers received any pension benefit payments during the fiscal year ended December 31, 2015.2016.
The present value accumulated by each Named Executive Officer from each plan is shown in the table below:
| | | Name | Plan Name | Number of Years of Credited Service(1) (#) | Present Value of Accumulated Benefit(2) ($) | Plan Name | Number of Years of Credited Service(1) (#) | Present Value of Accumulated Benefit(2) ($) | | David R. Emery | Pension Plan | 26.33 | |
| $828,269 |
| | Pension Plan | 27.33 | |
| $913,940 |
| | | | Pension Restoration Benefit | 26.33 | |
| $4,753,894 |
| | Pension Restoration Benefit | 27.33 | |
| $5,395,684 |
| | | | Grandfathered Pension Equalization Plan | 20.00 | |
| $685,067 |
| | Grandfathered Pension Equalization Plan | 21.00 | |
| $745,585 |
| | | | 2005 Pension Equalization Plan | 20.00 | |
| $2,720,559 |
| | 2005 Pension Equalization Plan | 21.00 | |
| $2,993,737 |
| | | Richard W. Kinzley | Pension Plan | 10.50 | |
| $192,198 |
| | Pension Plan | 10.50 | |
| $214,510 |
| | | | Pension Restoration Benefit | 10.50 | |
| $11,961 |
| | Pension Restoration Benefit | 10.50 | |
| $13,142 |
| | | Linden R. Evans | Pension Plan | 8.58 | |
| $220,131 |
| | Pension Plan | 8.58 | |
| $242,389 |
| | | | Pension Restoration Benefit | 8.58 | |
| $177,993 |
| | Pension Restoration Benefit | 8.58 | |
| $193,446 |
| | | Steven J. Helmers | Pension Plan | 8.92 | |
| $297,944 |
| | | | Brian G. Iverson | | Pension Plan | 5.83 | |
| $129,097 |
| | | Scott A. Buchholz | | Pension Plan | 37.17 | |
| $1,260,989 |
| | | | Pension Restoration Benefit | 8.92 | |
| $186,008 |
| | Pension Restoration Plan | 37.17 | |
| $998,045 |
| | | | Grandfathered Pension Equalization Plan | 13.00 | |
| $179,058 |
| | | | | 2005 Pension Equalization Plan | 13.00 | |
| $1,365,807 |
| | | | Robert A. Myers | No Benefits | | | | |
| | | (1) | The number of years of credited service represents the number of years used in determining the benefit for each plan. The Pension Equalization Plans are not directly tied to service but rather the number of years of participation in the plan. |
| | | (2) | The present value of accumulated benefits was calculated assuming the participants will work until retirement, benefits commence at age 62 and using the discount rate, mortality rate and assumed payment form assumptions consistent with those disclosed in Note 18 of the Notes to the Consolidated Financial Statements in our Annual Report on Form 10-K for the year ended December 31, 2015. 2016. |
Defined Benefit Pension PlanDEFINED BENEFIT PENSION PLAN
Our Pension Plan is a qualified pension plan in which all of our Named Executive Officers except Mr. Myers are included. As discussed above, effective January 1, 2010,several years ago we amended our Pension Plan to incorporate a partial freeze in which the accrual of benefits ceased for certain participants while other participants were allowed an election to continue to accrue benefits. Mr.Messrs. Emery wasand Buchholz were the only Named Executive OfficerOfficers who met the age and service requirement and elected to continue with the existing plan.
The Pension Plan provides benefits at retirement based on length of employment service and average compensation levels during the highest five consecutive years of the last ten years of service. For purposes of the benefit calculation, earnings include wages and other cash compensation received from us, including any bonus, commission, unused paid time off or incentive compensation. It also includes any elective before-tax contributions made by the employee to a Company sponsored cafeteria plan or 401(k) plan. However, it does not include any expense reimbursements, taxable fringe benefits, moving expenses or moving/relocation allowances, nonqualified deferred compensation, non-cash incentives, stock options and any payments of long-term incentive compensation such as restricted stock or payments under performance share plans. The
Internal Revenue Code places maximum limitations on the amount of compensation that may be recognized when determining benefits of qualified pension plans. In 2015,2016, the maximum amount of compensation that could be recognized when determining compensation was $265,000 (called “covered compensation”). Our employees do not contribute to the plan. The amount of the annual contribution by us to the plan is based on an actuarial determination.
The benefit formula for the Named Executive Officers in the Plan is the sum of (a) and (b) below.
| | | (a) | Credited Service after January 31, 2000 |
| | | | | 0.9% of average earnings (up to covered compensation), multiplied by credited service after January 31, 2000 minus the number of years of credited service before January 31, 2000 |
Plus | 1.3% of average earnings in excess of covered compensation, multiplied by credited service after January 31, 2000 minus the number of years of credited service before January 31, 2000 |
Plus
| | | (b) | Credited Service before January 31, 2000 |
| | | | | 1.2% of average earnings (up to covered compensation), multiplied by credited service before January 31, 2000 |
Plus | 1.6% of average earnings in excess of covered compensation, multiplied by credited service before January 31, 2000 |
Pension benefits are not reduced for social security benefits. The Internal Revenue Code places maximum limitations on annual benefit amounts that can be paid under qualified pension plans. In 2015,2016, the maximum benefit payable under qualified pension plans was $210,000. Accrued benefits become 100 percent vested after an employee completes five years of service. None of our Named Executive Officers has been credited with extra years of credited service under the plan.
Normal retirement is defined as age 65 under the plan. However, a participant may retire and begin taking unreduced benefits at age 62 with five years of service. Participants who have completed at least five years of credited service can retire and receive defined benefit pension benefits as early as age 55. However, the retirement benefit will be reduced by five percent for each year of retirement before age 62. For example, a participant with at least five years of credited service may retire at age 55 and receive a pension benefit equal to 65 percent of the normal retirement benefit. Mr. HelmersBuchholz is currently age 5955 and is entitled to early retirement benefits under this provision.
A participant who has left employment with us prior to reaching his or her earliest retirement date but who was vested in retirement benefits under the Pension Plan may begin receiving the full value of his or her vested benefit at age 65 or can receive a reduced benefit as early as age 55 if he or she has at least five years of credited service when he or she leaves employment with us. The benefit will be reduced by five percent for each year he or she begins receiving benefits prior to age 65. For example, a participant who leaves employment with us before reaching age 55 with at least five years of credited service may begin receiving benefits at age 55 equal to 50 percent of the normal retirement benefit and may begin receiving retirement benefits at age 65 on an unreduced basis.PENSION EQUALIZATION PLANS AND PENSION RESTORATION BENEFIT
If a participant is single, the benefit is paid as a life annuity. If a participant is married, the benefit is paid as a joint and 50 percent survivor annuity unless an optional form of payment is chosen.
Pension Equalization Plans and Pension Restoration Benefit
We also have a Grandfathered Pension Equalization Plan, a 2005 Pension Equalization Plan and a Pension Restoration Benefit. These are nonqualified supplemental plans, in which benefits are not tax deductible until paid. The plans are designed to provide the higher paid executive employee a retirement benefit which, when added to social security benefits and the pension to be received under the Pension Plan, will approximate retirement benefits being paid by other employers to their employees in similar executive positions. The employee’s pension from the qualified pension plan is limited by the Internal Revenue Code. The 20152016 pension limit was set at $210,000 annually and the compensation taken into account in determining contributions and benefits could not exceed $265,000 and could not include nonqualified deferred compensation. The amount of deferred compensation paid under nonqualified plans is not subject to these limits.
As a result of the change in the Pension Plan effective January 1, 2010,discussed above, the benefits for certain officers (including Messrs. Kinzley, Evans, Helmers and Myers)Iverson) under the Nonqualified Pension Plans were significantly reduced because the nonqualified benefit calculations were linked to the benefits earned in the Pension Plan. As a result, effective January 1, 2010, theThe Compensation Committee amended the Nonqualified Deferred Compensation Plan to provide non-elective nonqualified restoration benefits to those affected officers who were not eligible to continue accruing benefits under the Pension Plan and Nonqualified Pension Plans.
Grandfathered Pension Equalization Plan and 2005 Pension Equalization Plan. The Grandfathered Pension Equalization Plan provides the pension equalization benefits to each participant who had earned and vested benefits before January 1, 2005, and is not subject to the provisions of Section 409A of the Internal Revenue Code. The 2005 Pension Equalization Plan provides the pension equalization benefits to each participant that were earned and vested on or after January 1, 2005, and is subject to the provisions of Section 409A.
These plans have been frozen to new participants since 2002. A participant under the Grandfathered and 2005 Pension Equalization Plans does not qualify for benefits until the benefits become vested underMr. Emery is a defined vesting schedule. A participant is fully vested after eight years of employment under the plan. Messrs. Emery and Helmers are fully vested participantsparticipant in the Grandfathered and 2005 Pension Equalization Plans. Messrs. Kinzley, Evans, Iverson, and MyersBuchholz are not participants in these plans.
The annual benefit for Mr. Emery is 2530 percent of the employee’shis average earnings if salary was less than two times the Social Security Wage Base, or 30 percent, if salary was more than two times the Social Security Wage Base, multiplied by the vesting percentage. Average earnings are normally an employee’s average earnings for the five highest consecutive full years of employment during the ten full years
of employment immediately preceding the year of calculation. The annual benefit is paid on a monthly basis for 15 years to each participating employee and, if deceased, to the employee’s designated beneficiary or estate, commencing at the earliest of death or when the employee is both retired and 62 years of age or more. A participant with vested benefits who is 55 years of age or older and who is no longer our employee may elect to be paid benefits beginning at age 55 or older, subject to a discount, ranging from 60.3 percent of such benefits accordingthe benefit payable at age 55 to 93 percent of the following schedule.
| | | | | | | | | Age at Start of Payments | | % of Benefit Payable | | Age at Start of Payments | | % of Benefit Payable | | 61 | | 93.0% | | 57 | | 69.7% | | 60 | | 86.5% | | 56 | | 64.8% | | 59 | | 80.5% | | 55 | | 60.3% | | 58 | | 74.9% | | | | |
Pension Restoration Benefit. In the event that at the time of a participant’s retirement, the participant’s salary level exceeds the qualified pension plan annual compensation limitation ($265,000 in 2015)2016) or includes nonqualified deferred compensation, then the participant will receive an additional benefit, called a “Pension Restoration Benefit,” which is measured by the difference between (i) the monthly benefit which would have been provided to the participant under the Pension Plan as if there were no annual compensation limitation and no exclusion on nonqualified deferred compensation, and (ii) the monthly benefit to be provided to the participant under the Pension Plan. The Pension Restoration Benefit applies to all of the Named Executive Officers that have a Pension Benefit.
NONQUALIFIED DEFERRED COMPENSATION FOR 20152016
We have a Nonqualified Deferred Compensation Plan for a select group of management or highly compensated employees. Eligibility to participate in the plan is determined by the Compensation Committee and primarily consists of only corporate officers.
A summary of the activity in the plan and the aggregate balance as of December 31, 20152016 for our Named Executive Officers is shown in the following table. Our Named Executive Officers received no withdrawals or distributions from the plan in 2015.2016. | | | Name | |
Executive Contributions(1) | Company Contributions in Last Fiscal Year(2) | | Aggregate Earnings in Last Fiscal Year(3) | | Aggregate Balance at Last Fiscal Year End(4) | |
Executive Contributions(1) | Company Contributions in Last Fiscal Year(2) | | Aggregate Earnings in Last Fiscal Year(3) | | Aggregate Balance at Last Fiscal Year End(4) | | David R. Emery | | $— |
| | $— |
| | | $— |
| | | $— |
| | | $— |
| | $— |
| | $— |
| | $— |
| | | Richard W. Kinzley | |
| $— |
| |
| $114,226 |
| |
| ($343 | ) | |
| $535,375 |
| | |
| $— |
| |
| $117,736 |
| |
| $59,809 |
| |
| $712,919 |
| | | Linden R. Evans | |
| $— |
| |
| $286,980 |
| |
| ($3,547 | ) | |
| $1,367,184 |
| | |
| $— |
| |
| $211,972 |
| |
| $171,866 |
| |
| $1,748,759 |
| | | Steven J. Helmers | |
| $— |
| |
| $93,873 |
| |
| ($1,037 | ) | |
| $417,882 |
| | | | Robert A. Myers | |
| $117,382 |
| |
| $124,319 |
| |
| ($4,537 | ) | |
| $1,121,864 |
| | | | Brian G. Iverson | | |
| $— |
| |
| $57,610 |
| |
| $15,179 |
| |
| $249,995 |
| | | Scott A. Buchholz | | |
| $— |
| |
| $68,375 |
| |
| $35,266 |
| |
| $533,272 |
| |
| | | (1) | Mr. Myers' contributions of $117,382 are included in the Non-Equity Incentive Plan Compensation column in the Summary Compensation Table for 2014 earnings. |
| | (2) | Our contributions represent non-elective Supplemental Matching and Retirement Contributions and Supplemental Target Contributions (defined in the paragraph below) and are included in the All Other Compensation column of the Summary Compensation Table. The value attributed from each contribution type to each Named Executive Officer in 20152016 is shown in the table below: |
| | | Name | | Supplemental Matching Contribution | | Supplemental Retirement Contribution | | Supplemental Target Contribution | | Total Company Contributions | | Supplemental Matching Contribution | | Supplemental Retirement Contribution | | Supplemental Target Contribution | | Total Company Contributions | | David R. Emery | | $— |
| | | $— |
| | | $— |
| | | $— |
| | | $— |
| | $— |
| | $— |
| | $— |
| | | Richard W. Kinzley | |
| $13,800 |
| |
| $13,800 |
| |
| $86,626 |
| |
| $114,226 |
| | |
| $14,514 |
| |
| $14,514 |
| |
| $88,708 |
| |
| $117,736 |
| | | Linden R. Evans | |
| $43,871 |
| |
| $43,871 |
| |
| $199,238 |
| |
| $286,980 |
| | |
| $29,807 |
| |
| $29,807 |
| |
| $152,358 |
| |
| $211,972 |
| | | Steven J. Helmers | |
| $21,521 |
| |
| $28,694 |
| |
| $43,657 |
| |
| $93,872 |
| | | | Robert A. Myers | |
| $10,863 |
| |
| $10,863 |
| |
| $102,593 |
| |
| $124,319 |
| | | | Brian G. Iverson | | |
| $10,923 |
| |
| $10,923 |
| |
| $35,764 |
| |
| $57,610 |
| | | Scott A. Buchholz | | |
| $9,383 |
| |
| $— |
| |
| $58,992 |
| |
| $68,375 |
| |
| | (3)(2) | Because amounts included in this column do not include above-market or preferential earnings, none of these amounts are included in the “Change in Pension Value and Nonqualified Deferred Compensation Earnings” column of the Summary Compensation Table. |
| | (4)(3) | Messrs. Kinzley’s, Evans’, Helmers’Iverson’s and Myers’Buchholz’s aggregate balances at December 31, 20152016 include $114,226, $778,265, $240,936$231,963, $743,406, $57,610 and $610,331,$68,375, respectively, which are included in the Summary Compensation Table as 2016, 2015, 2014 and 20132014 compensation. |
Eligible employees may elect to defer up to 50 percent of their base salary and up to 100 percent of their Short-Term Incentive Plan award, including Company stock, and elect to defer restricted stock grants in the form of restricted stock units. In addition, the Nonqualified Deferred Compensation Plan was amended effective January 1, 2010 to provide certain officers whose Pension Plan benefit and Nonqualified Pension Plans’ benefits were frozen effective January 1, 2010, with non-elective supplemental matching contributions equal to 6 percent of eligible compensation in excess of the Internal Revenue Code limit plus matching contributions, if any, lost under the 401(k) Retirement Savings Plan due to nondiscrimination test results and provides non-elective supplemental age and service points-based contributions that cannot be made to the 401(k) Retirement Savings Plan due to the Internal Revenue Code limit (“Supplemental Matching and Retirement Contributions”). It also provides supplemental target contributions equal to a percentage of compensation that may differ by executive, based on the executive’s current age and length of service with us, as determined by the plans’ actuary (“Supplemental Target Contributions”). Messrs. Kinzley, Evans, HelmersIverson and MyersBuchholz received Supplemental Target Contributions of 17.5 percent, 20.020 percent, 7.08 percent and 23.014 percent, respectively.
The deferrals are deposited into hypothetical investment accounts where the participants may direct the investment of the deferrals (except for Company stock and restricted stock unit deferrals) as allowed by the plan. The investment options are the same as those offered to all employees in the 401(k) Retirement Savings Plan except for a fixed rate option, which was set at 3.24
3.09 percent in 2015.2016. Investment earnings are credited to the participants’ accounts. Upon retirement, we will distribute the account balance to the participant according to the distribution election filed with the Compensation Committee. The participants may elect either a lump sum payment to be paid within 30 days of retirement (requires a six-month deferral for benefits not vested as of December 31, 2004), or annual or monthly installments over a period of years designated by the participant, but not to exceed 15 years. As of January 1, 2016,2017, Messrs. Kinzley, Evans, HelmersIverson and MyersBuchholz are 100 percent vested in the plan.
POTENTIAL PAYMENTS UPON TERMINATION OR CHANGE IN CONTROL
The following table describes the potential payments and benefits under our compensation and benefit plans and arrangements to which our Named Executive Officers would be entitled upon termination of employment. Except for (i) certain terminations following a change in control (“CIC”) of us, as described below, (ii) pro-rata payout of incentive compensation and the acceleration of vesting of equity awards upon retirement, death or disability, and (iii) certain pension and nonqualified deferred compensation arrangements described under Pension Benefits for 20152016 and Nonqualified Deferred Compensation for 20152016 above, there are no agreements, arrangements or plans that entitle the Named Executive Officers to severance, perquisites, or other enhanced benefits upon termination of their employment. Any agreements to provide other payments or benefits to a terminating executive officer would be in the discretion of the Compensation Committee.
The amounts shown below assume that such termination was effective as of December 31, 2015,2016, and thus include estimates of the amounts that would be paid out to our Named Executive Officers upon their termination. The table does not include amounts such as base salary, short-term incentives and stock awards that the Named Executive Officers earned due to employment through December 31, 20152016 and distributions of vested benefits such as those described under Pension Benefits for 20152016 and Nonqualified Deferred Compensation for 2015.2016. The table also does not include a value for outplacement services because this would be a de minimis amount. The actual amounts to be paid can only be determined at the time of such Named Executive Officer’s separation from us.
| | | | | Cash Severance Payment | | Incremental Retirement Benefit (present value)(2) | | Continuation of Medical/ Welfare Benefits (present value)(3) | | Acceleration of Equity Awards(4) | | Total Benefits | | Cash Severance Payment | | Incremental Retirement Benefit (present value)(2) | | Continuation of Medical/ Welfare Benefits (present value)(3) | | Acceleration of Equity Awards(4) | | Total Benefits | | David R. Emery | David R. Emery | | | | | | | | | | David R. Emery | | | | | | | | | | | • | Retirement | — |
| | — |
| | — |
| |
| $81,742 |
| |
| $81,742 |
| Retirement | — |
| | — |
| | — |
| |
| $963,780 |
| |
| $963,780 |
| | • | Death or disability | — |
| | — |
| | — |
| |
| $1,295,700 |
| |
| $1,295,700 |
| Death or disability | — |
| | — |
| | — |
| |
| $3,033,839 |
| |
| $3,033,839 |
| | • | Involuntary termination | — |
| | — |
| | — |
| | — |
| | — |
| Involuntary termination | — |
| | — |
| | — |
| | — |
| | — |
| | • | CIC | — |
| | — |
| | — |
| |
| $1,213,959 |
| |
| $1,213,959 |
| CIC | — |
| | — |
| | — |
| |
| $3,156,063 |
| |
| $3,156,063 |
| | • | Involuntary or good reason termination after CIC(1) |
| $4,215,302 |
| |
| $1,130,000 |
| |
| $114,900 |
| |
| $1,213,959 |
| |
| $6,674,161 |
| Involuntary or good reason termination after CIC(1) |
| $4,616,560 |
| |
| $1,179,500 |
| |
| $117,000 |
| |
| $3,156,063 |
| |
| $9,069,123 |
| | Richard W. Kinzley | Richard W. Kinzley | | | | | | | | | | Richard W. Kinzley | | | | | | | | | | | • | Retirement | — |
| | — |
| | — |
| |
| $13,366 |
| |
| $13,366 |
| Retirement | — |
| | — |
| | — |
| |
| $176,865 |
| |
| $176,865 |
| | • | Death or disability | — |
| | — |
| | — |
| |
| $211,808 |
| |
| $211,808 |
| Death or disability | — |
| | — |
| | — |
| |
| $730,533 |
| |
| $730,533 |
| | • | Involuntary termination | — |
| | — |
| | — |
| | — |
| | — |
| Involuntary termination | — |
| | — |
| | — |
| | — |
| | — |
| | • | CIC | — |
| | — |
| | — |
| |
| $198,442 |
| |
| $198,442 |
| CIC | — |
| | — |
| | — |
| |
| $754,390 |
| |
| $754,390 |
| | • | Involuntary or good reason termination after CIC(1) |
| $990,000 |
| |
| $292,050 |
| |
| $124,300 |
| |
| $198,442 |
| |
| $1,604,792 |
| Involuntary or good reason termination after CIC(1) |
| $1,161,600 |
| |
| $292,050 |
| |
| $109,200 |
| |
| $754,390 |
| |
| $2,317,240 |
| | Linden R. Evans | Linden R. Evans | | | | | | | | | | Linden R. Evans | | | | | | | | | | | • | Retirement | — |
| | — |
| | — |
| |
| $25,994 |
| |
| $25,994 |
| Retirement | — |
| | — |
| | — |
| |
| $304,994 |
| |
| $304,994 |
| | • | Death or disability | — |
| | — |
| | — |
| |
| $887,596 |
| |
| $887,596 |
| Death or disability | — |
| | — |
| | — |
| |
| $1,773,653 |
| |
| $1,773,653 |
| | • | Involuntary termination | — |
| | — |
| | — |
| | — |
| | — |
| Involuntary termination | — |
| | — |
| | — |
| | — |
| | — |
| | • | CIC | — |
| | — |
| | — |
| |
| $861,602 |
| |
| $861,602 |
| CIC | — |
| | — |
| | — |
| |
| $1,810,907 |
| |
| $1,810,907 |
| | • | Involuntary or good reason termination after CIC(1) |
| $1,534,500 |
| |
| $491,040 |
| |
| $66,400 |
| |
| $861,602 |
| |
| $2,953,542 |
| Involuntary or good reason termination after CIC(1) |
| $1,617,000 |
| |
| $521,730 |
| |
| $70,500 |
| |
| $1,810,907 |
| |
| $4,020,137 |
| | Steven J. Helmers | | | | | | | | | | | | Brian G. Iverson | | Brian G. Iverson | | | | | | | | | | | • | Retirement | — |
| | — |
| | — |
| |
| $16,673 |
| |
| $16,673 |
| Retirement | — |
| | — |
| | — |
| |
| $154,322 |
| |
| $154,322 |
| | • | Death or disability | — |
| | — |
| | — |
| |
| $275,613 |
| |
| $275,613 |
| Death or disability | — |
| | — |
| | — |
| |
| $607,266 |
| |
| $607,266 |
| | • | Involuntary termination | — |
| | — |
| | — |
| | — |
| | — |
| Involuntary termination | — |
| | — |
| | — |
| | — |
| | — |
| | • | CIC | — |
| | — |
| | — |
| |
| $258,940 |
| |
| $258,940 |
| CIC | — |
| | — |
| | — |
| |
| $627,699 |
| |
| $627,699 |
| | • | Involuntary or good reason termination after CIC(1) |
| $1,029,500 |
| |
| $305,695 |
| |
| $31,100 |
| |
| $258,940 |
| |
| $1,625,235 |
| Involuntary or good reason termination after CIC(1) |
| $957,000 |
| |
| $191,400 |
| |
| $54,500 |
| |
| $627,699 |
| |
| $1,830,599 |
| | Robert A. Myers | | | | | | | | | | | | Scott A. Buchholz | | Scott A. Buchholz | | | | | | | | | | | • | Retirement | — |
| | — |
| | — |
| |
| $13,482 |
| |
| $13,482 |
| Retirement | — |
| | — |
| | — |
| |
| $131,452 |
| |
| $131,452 |
| | • | Death or disability | — |
| | — |
| | — |
| |
| $223,300 |
| |
| $223,300 |
| Death or disability | — |
| | — |
| | — |
| |
| $555,730 |
| |
| $555,730 |
| | • | Involuntary termination | — |
| | — |
| | — |
| | — |
| | — |
| Involuntary termination | — |
| | — |
| | — |
| | — |
| | — |
| | • | CIC | — |
| | — |
| | — |
| |
| $209,817 |
| |
| $209,817 |
| CIC | — |
| | — |
| | — |
| |
| $570,543 |
| |
| $570,543 |
| | • | Involuntary or good reason termination after CIC(1) |
| $957,000 |
| |
| $334,950 |
| |
| $33,400 |
| |
| $209,817 |
| |
| $1,531,167 |
| Involuntary or good reason termination after CIC(1) |
| $884,500 |
| |
| $364,505 |
| |
| $43,100 |
| |
| $570,543 |
| |
| $1,862,648 |
|
| | | (1) | The amounts reflected for involuntary or good reason termination after a change in control include the benefits a Named Executive Officer would receive in the event of a change in control as a sole event without the involuntary or good reason termination. |
| | | (2) | Assumes that in the event of a change in control, Mr. Emery will receive an additional three years of credited and vesting service and the other Named Executive Officers will receive an additional two years of credited and vesting service towards the benefit accrual under their applicable retirement plans. For Mr. Emery this would be the Pension Plan and Nonqualified Pension Plans. For Messrs. Kinzley, Evans, HelmersIverson and MyersBuchholz this would be the Retirement Contributions and Nonqualified Deferred Compensation contributions.Contributions. In addition, Mr. Buchholz would also have a Pension Restoration Contribution. The benefits will immediately vest and payments will commence at the earliest eligible date unless the executive has elected a later date for the nonqualified plans. This is age 55 for Messrs. Emery, Kinzley, Evans, Iverson, and Evans. Because Messrs. Helmers and Myers are ages 59 and 58, respectively, they are already retiree eligible.Buchholz. |
| | | (3) | Welfare benefits include medical coverage, dental coverage, life insurance, short-term disability coverage and long-term disability coverage. The calculation assumes that the Named Executive Officer does not take employment with another employer following termination, elects continued welfare benefits until age 55 or, if later, the end of the two year benefit continuation period (three years for Mr. Emery) and elects retiree medical benefits thereafter. Retirement is assumed to occur at the earliest eligible date. |
| | | (4) | In the event of retirement, death or disability, the acceleration of equity awards represents the acceleration of unvested restricted stock/units and the assumed payout of the pro-rata share of the performance shares for the January 1, 2014 to December 31, 2016 and January 1, 2015 to December 31, 2017 and January 1, 2016 to December 31, 2018 performance periods. We assumed a 776 percent payout of the performance shares for the January 1, 2014 to December 31, 2016 performance period and a 27 percent payout of target for the January 1, 2015 to December 31, 2017 performance period and a 140 percent payout of target for the January 1, 2016 to December 31, 2018 performance period based on our Monte Carlo valuations at December 31, 2015.2016. In the event of retirement, all unvested restricted stock is forfeited. |
In the event of a change in control or an involuntary or good reason termination after a change in control, the acceleration of equity awards represents the acceleration of unvested restricted stock/units and the payout of the pro-rata share of the performance shares calculated as if the performance period ended on December 31, 20152016 for the January 1, 2014 to December 31, 2016 and January 1, 2015 to December 31, 2017 and January 1, 2016 to December 31, 2018 performance periods.
The valuation of the restricted stock was based upon the closing price of our common stock on December 31, 2015,2016, and the valuation of the performance shares was based on the average closing price of our common stock for the last 20 trading days of 2015.2016. Actual amounts to be paid out at the time of separation from us may vary significantly based upon the market value of our common stock at that time.
Payments Made Upon Termination. Regardless of the manner in which a Named Executive Officer’s employment terminates, he or his beneficiaries may be entitled to receive amounts earned during his term of employment. These include:
accrued salary and unused vacation pay; amounts vested under the Pension Plan and Nonqualified Pension Plans; amounts vested under the Nonqualified Deferred Compensation Plan; and amounts vested under the 401(k) Retirement Savings Plan.
Payments Made Upon Retirement. In the event of retirement of a Named Executive Officer, in addition to the items identified above, he will also receive the benefit of the following:
a pro-rata share of the performance shares for each outstanding performance period upon completion of the performance period; and a pro-rata share of the actual payout under the Short-Term Incentive Plan upon completion of the incentive period.
Payments Made Upon Death or Disability. In the event of death or disability of a Named Executive Officer, in addition to the items identified above for payments made upon termination, he will also receive the benefit of the following:
accelerated vesting of restricted stock and restricted stock units; a pro-rata share of the performance shares for each outstanding performance period upon completion of the performance period; and a pro-rata share of the actual payout under the Short-Term Incentive Plan upon completion of the incentive period.
Payments Made Upon a Change in Control. Our Named Executive Officers have change in control agreements that terminate November 15, 2016.2019. The renewal of the change in control agreements is at the discretion of the Compensation Committee and the Board of Directors. The change in control agreements provide for certain payments and other benefits to be payable upon a change in control and a subsequent termination of employment, either involuntary or for a good reason. In order to receive any payments under the agreements the Named Executive Officer must sign a waiver which includes a one-year non-competition clause and two-year non-solicitation and non-disparagement clauses.
A change in control is defined in the agreements as: an acquisition of 30 percent or more of our common stock, except for certain defined acquisitions, such as acquisition by employee benefit plans, us, any of our subsidiaries, or acquisition by an underwriter holding the securities in connection with a public offering thereof; or
members of our incumbent Board of Directors cease to constitute at least two-thirds of the members of the Board of Directors, with the incumbent Board of Directors being defined as those individuals consisting of the Board of Directors on the date the agreement was executed and any other directors elected subsequently whose election was approved by the incumbent Board of Directors; or approval by our shareholders of: | | | - | a merger, consolidation, or reorganization; |
| | | - | liquidation or dissolution; or |
| | | - | an agreement for sale or other disposition of all or substantially all of our assets, with exceptions for transactions which do not involve an effective change in control of voting securities or Board of Directors membership, and transfers to subsidiaries or sale of subsidiaries; and |
all regulatory approvals required to effect a change in control have been obtained and the transaction constituting the change in control has been consummated.
In the change in control agreements, a good reason for termination that triggers payment of benefits includes:
a material reduction of the executive’s authority, duties or responsibilities; a reduction in the executive’s annual compensation or any failure to pay the executive any compensation or benefits to which he or she is entitled within seven days of the date due; any material breach by us of any provisions of the change in control agreement; requiring the executive to be based outside a 50-mile radius from his or her usual and normal place of work; or our failure to obtain an agreement, satisfactory to the executive, from any successor company to assume and agree to perform under the change in control agreement.
Upon a change in control, the CEO will have an employment contract for a three-year period and the non-CEO executive will have an employment contract for a two-year period, but not beyond age 65 (“employment term”). During this employment term, the executive will receive annual compensation at least equal to the highest rate in effect at any time during the one-year period preceding the change in control and will also receive employment welfare benefits, pension benefits and supplemental retirement benefits on a basis no less favorable than those received prior to the change in control. Annual compensation is defined to include amounts which are includable in the gross income of the executive for federal income tax purposes, including base salary, targeted short-term incentive, targeted long-term incentive grants and awards; and matching contributions or other benefits payable under the 401(k) Retirement Savings Plan; but exclude restricted stock awards, performance units or stock options that become vested or exercisable pursuant to a change in control.
If a Named Executive Officer’s employment is terminated prior to the end of the employment term by us for cause or disability, by reason of the Named Executive Officer’s death, or by the Named Executive Officer without good reason, the Named Executive Officer will receive all amounts of compensation earned or accrued through the termination date. If the Named Executive Officer’s employment is terminated because of death or disability, the Named Executive Officer or his beneficiaries will also receive a pro rata bonus equal to 100 percent of the target incentive for the portion of the year served.
If the CEO’s employment is terminated during the employment term (other than by reason of death) (i) by us other than for cause or disability, or (ii) by the CEO for a good reason, then the CEO is entitled to the following benefits: all accrued compensation and a pro rata bonus (the same as the CEO or the CEO’s beneficiaries would receive in the event of death or disability discussed above); severance pay equal to 2.99 times the CEO’s severance compensation defined as the CEO’s base salary and short-term incentive target on the date of the change in control; provided that if the CEO has attained the age of 62 on the termination date, the severance payment will be adjusted for the ratio of the number of days remaining to the CEO’s 65th birthday to 1,095 days; continuation of employee welfare benefits for three years following the termination date unless the CEO becomes covered under the health insurance coverage of a subsequent employer which does not contain any exclusion or limitation with respect to any preexisting condition of the CEO or the CEO’s eligible dependents; following the three-year period, the CEO may elect to receive coverage under the employee welfare plans of the successor entity at his then-current level of benefits (or reduced coverage at the CEO’s election) by paying the premiums charged to regular full-time employees for such coverage, and is eligible to continue receiving such coverage through the date of his retirement; three additional years of service and age will be credited to the CEO’s retiree medical savings account and the account balance will become fully vested and he is eligible to use the account balance to offset retiree medical premiums at the later of age 55 or the end of the three year continuation period;
three years of additional credited service under the 2005 Pension Equalization Plan, Pension Restoration Plan and Pension Plan; and outplacement assistance services for up to six months.
If any non-CEO Named Executive Officer’s employment is terminated during the employment term (other than by death) (i) by us other than for cause or disability, or (ii) by the non-CEO for a good reason, then the non-CEO is entitled to the following benefits:
all accrued compensation and a pro rata bonus (the same as the non-CEO or the non-CEO’s beneficiaries would receive in the event of death or disability discussed above); severance pay equal to two times the non-CEO’s severance compensation defined as the non-CEO’s base salary and short-term incentive target on the date of the change in control; provided that if the non-CEO has attained the age of 63 on the termination date, the severance payment shall be adjusted for the ratio of the number of days remaining to the non-CEO’s 65th birthday to 730 days; continuation of employee welfare benefits for two years following the termination date unless the non-CEO becomes covered under the health insurance coverage of a subsequent employer which does not contain any exclusion or limitation with respect to any preexisting condition of the non-CEO or the non-CEO’s eligible dependents; following the two-year period, the non-CEO may elect to receive coverage under the employee welfare plans of the successor entity at his then-current level of benefits (or reduced coverage at the non-CEO’s election) by paying the premiums charged to regular full-time employees for such coverage, and is eligible to continue receiving such coverage through the date of his retirement; two additional years of service and age will be credited to the non-CEO’s retiree medical savings account and the account balance will become fully vested and the non-CEO is eligible to use the account balance to offset retiree medical premiums at the later of age 55 or the end of the two year continuation period; two years of additional credited service under the executives’ applicable retirement plans; and outplacement assistance services for up to six months.
The change in control agreements do not contain a benefit to cover any excise tax imposed by Section 4999 of the Internal Revenue Code of 1986. The executive must sign a waiver and release agreement in order to receive the severance payment.
Proposal 4
| | | | | | | PROPOSAL 3 | ADVISORY VOTE ON OUR EXECUTIVE COMPENSATION |
We are providing shareholders with an advisory, non-binding vote on the executive compensation of our Named Executive Officers (commonly referred to as “say on pay”). Accordingly, shareholders will vote on approval of the following resolution:
RESOLVED, that the shareholders approve, on an advisory basis, the compensation of our Named Executive Officers as disclosed in the Compensation Discussion and Analysis section, the accompanying compensation tables and the related narrative disclosure in this proxy statement.
This vote is non-binding. The Board of Directors and the Compensation Committee expect to consider the outcome of the vote when considering future executive compensation decisions to the extent they can determine the cause or causes of any significant negative voting results. At our 20152016 annual meeting, shareholders owning 9596 percent of the shares voted approved our executive compensation.
As described at length in the Compensation Discussion and Analysis section of this proxy statement, we believe our executive compensation program is reasonable, competitive and strongly focused on pay for performance. The compensation of our Named Executive Officers varies depending upon the achievement of pre-established performance goals, both individual and corporate. Our short-term incentive is tied to earnings per share targets that reward our executives when they deliver targeted financial results. Our long-term incentives are tied to market performance with 50 percent delivered in restricted stock and 50 percent delivered in performance shares. Entitlement to the performance shares is based on our total shareholder return over a three-year performance period compared to our peer group. Through stock ownership guidelines, equity incentives and clawback provisions, we align the interests of our executives with those of our shareholders and our long-term interests. Our executive compensation policies have enabled us to attract and retain talented and experienced senior executives who can drive financial and strategic growth objectives that are intended to enhance shareholder value. We believe that the 20152016 compensation of our Named Executive Officers was appropriate and aligned with our 20152016 results and positions us for long-term growth.
Shareholders are encouraged to read the Compensation Discussion and Analysis, the accompanying compensation tables, and the related narrative disclosures to better understand the compensation of our Named Executive Officers.
The advisory resolution to approve executive compensation is non-binding. However, our Board of Directors will consider shareholders to have approved our executive compensation if the number of votes cast “For” the proposal exceeds the number of votes cast “Against” the proposal. Abstentions and broker non-votes will have no effect on such vote.
The Board of Directors recommends a vote FOR the advisory vote on executive compensation.
| | | | | | PROPOSAL 4
| ADVISORY VOTE ON THE FREQUENCY OF THE ADVISORY VOTE ON OUR EXECUTIVE COMPENSATION |
The Company is required to seek an advisory, non-binding shareholder vote on the frequency of submission to shareholders of the advisory vote on executive compensation once every year, every two years or every three years.
This vote is non-binding. The Board will review the voting results and expects to take the outcome of the vote into account when selecting the frequency of advisory votes on executive compensation.
The Board of Directors recognizes the importance of receiving regular input from our shareholders on important issues such as executive compensation and has been asking shareholders to provide their advisory vote on executive compensation annually for the last six years. The Board believes that an annual advisory vote on executive compensation is consistent with the Company's policy of seeking input from, and engaging in discussions with, our shareholders on corporate governance matters. The Board is recommending that we continue with an annual vote and that shareholders vote for the option of every year as the frequency with which shareholders will have a "say on pay". The Board understands that thoughtful analysis of executive compensation can be time consuming for shareholders and that it may be difficult to assess the impact of any changes to our compensation practices within a one-year period. Accordingly, the Board understands that shareholders may have different views on the appropriate frequency for the "say on pay" vote and looks forward to receiving input on this matter. Although the Board is recommending shareholders vote for the option of every year, for purposes of this proposal, shareholders are entitled to vote for any of the frequency alternatives and you are not voting on the Board's recommendation. The Company will report its determination about the frequency of the advisory vote on executive compensation in a Form 8-K or amendment to a Form 8-K filed within 150 days following the meeting.
The Board of Directors recommends a vote for the option of ONE YEAR as the frequency with which shareholders will have an advisory, non-binding vote on executive compensation.
.
TRANSACTION OF OTHER BUSINESS
Our Board of Directors does not intend to present any business for action by our shareholders at the meeting except the matters referred to in this proxy statement. If any other matters should be properly presented at the meeting, it is the intention of the persons named in the accompanying form of proxy to vote thereon in accordance with the recommendations of our Board of Directors.
SHAREHOLDER PROPOSALS FOR 20172018 ANNUAL MEETING
Shareholder proposals intended to be presented at our 20172018 annual meeting of shareholders and considered for inclusion in our proxy materials must be received by our Corporate Secretary in writing at our executive offices at 625 Ninth Street, PO Box 1400, Rapid City, South Dakota 57701, on or prior to November 17, 2016.16, 2017. Any proposal submitted must be in compliance with Rule 14a-8 of Regulation 14A of the Securities and Exchange Commission.
Additionally, a shareholder may submit a proposal or director nominee for consideration at our 20172018 annual meeting of shareholders, but not for inclusion of the proposal or director nominee in our proxy materials, if the shareholder gives timely written notice of such proposal in accordance with Article I, Section 9 of our Bylaws. In general, Article I, Section 9 provides that, to be timely, a shareholder’s notice must be delivered to our Corporate Secretary in writing not less than 90 days nor more than 120 days prior to the anniversary date of the immediately preceding annual meeting of shareholders.
Our 20162017 annual meeting is scheduled for April 26, 2016.25, 2017. Ninety days prior to the first anniversary of this date will be January 26, 2017,25, 2018, and 120 days prior to the first anniversary of this date will be December 27, 2016.26, 2017. For business to be properly requested by the shareholder to be brought before the 20172018 annual meeting of shareholders, the shareholder must comply with all of the requirements of Article I, Section 9 of our Bylaws, not just the timeliness requirements set forth above.
SHARED ADDRESS SHAREHOLDERS
In accordance with a notice sent to eligible shareholders who share a single address, we are sending only one annual report and proxy statement to that address unless we receive instructions to the contrary from any shareholder at that address. This practice, known as “householding,” is designed to reduce our printing and postage costs. However, if a shareholder of record residing at such an address wishes to receive a separate annual report or proxy statement in the future, he or she may contact Shareholder Relations at the below address. Eligible shareholders of record receiving multiple copies of our annual report and proxy statement can request householding by contacting us in the same manner. Shareholders who own shares through a bank, broker or other nominee can request householding by contacting the nominee.
We hereby undertake to deliver promptly, upon written or oral request, a separate copy of the annual report to shareholders, or proxy statement, as applicable, to our shareholders at a shared address to which a single copy of the document was delivered.
Shareholder Relations Black Hills Corporation 625 Ninth StreetPO Box 1400
Rapid City, SD 5770157709 (605) 721-1700
Please vote your shares by telephone, by the Internet or by promptly returning the accompanying form of proxy, whether or not you expect to be present at the annual meeting.
ANNUAL REPORT ON FORM 10-K
A copy of our Annual Report on Form 10-K (excluding exhibits), for the year ended December 31, 2015,2016, which is required to be filed with the Securities and Exchange Commission, will be made available to shareholders to whom this proxy statement is mailed, without charge, upon written or oral request to Shareholder Relations, Black Hills Corporation, 625 Ninth Street, PO Box 1400, Rapid City, SD 57701, Telephone Number: (605) 721-1700. Our Annual Report on Form 10-K also may be accessed through our website at www.blackhillscorp.com.
IMPORTANT NOTICE REGARDING THE AVAILABILITY OF PROXY MATERIALS FOR THE SHAREHOLDER MEETING TO BE HELD ON APRIL 26, 201625, 2017
Shareholders may view this proxy statement, our form of proxy and our 20152016 Annual Report to Shareholders over the Internet by accessing our website at www.blackhillscorp.com. Information on our website does not constitute a part of this proxy statement.
By Order of the Board of Directors, ROXANN R. BASHAM Vice President – Governance and Corporate Secretary
Dated: March 17, 201616, 2017
(This page left blank intentionally.)
Appendix A
Reconciliation of Non-GAAP Financial Measures | | | | | | | APPENDIX A | RECONCILIATION OF NON-GAAP FINANCIAL MEASURES |
| | | | | | | | | | | | | Year Ended Dec. 31, | | | 2015 | 2014 | 2010 | | | | | | | EPS from continuing operations (GAAP) | $ | (0.71 | ) | $ | 2.93 |
| $ | 1.73 |
| | Adjustments, after-tax: | | | | | Impairment of Oil and Gas assets | 3.48 |
| — |
| — |
| | Impairment of oil and gas equity investments | 0.06 |
| — |
| — |
| | Unrealized loss on certain interest rate swaps | — |
| — |
| 0.25 |
| | External acquisition costs | 0.15 |
| — |
| — |
| | Gain on partial sale of Wygen III | — |
| — |
| (0.10 | ) | | Gain on sale of Elkhorn, NE assets | — |
| — |
| (0.04 | ) | | Improved effective tax rate | — |
| — |
| (0.06 | ) | | Total adjustments | 3.69 |
| — |
| 0.05 |
| | EPS from continuing operations, as adjusted (Non-GAAP) | $ | 2.98 |
| $ | 2.93 |
| $ | 1.78 |
|
___________
1.7 percent growth in earnings per share from continuing operations, as adjusted, from 2014 to 2015
10.9 percent compound annual growth rate in earnings per share from continuing operations, as adjusted from 2010 to 2015 | | | | | | | Year Ended Dec. 31, 2016 | | | | | EPS from continuing operations (GAAP) | $ | 1.37 |
| | Adjustments, pre-tax: | | | Impairment of Oil and Gas assets | 2.01 |
| | External acquisition costs | 0.86 |
| | Total adjustments | 2.87 |
| | Tax on adjustments: | | | Oil and Gas impairments | (0.75 | ) | | Acquisition costs | (0.30 | ) | | Total tax on adjustments | $ | (1.05 | ) | | EPS from continuing operations, as adjusted (Non-GAAP) | $ | 3.19 |
|
USE OF NON-GAAP FINANCIAL MEASURE
In addition to presenting our earnings information in conformity with Generally Accepted Accounting Principles (GAAP), the company has provided non-GAAP earnings data reflecting adjustments for special items as specified in the GAAP to Non-GAAP adjustment reconciliation table above. Income (loss) from continuing operations, as adjusted, is defined as Income (loss) from continuing operations adjusted for expenses and gains that the company believes do not reflect the company’s core operating performance. The company believes that non-GAAP financial measures are useful to investors because the items excluded are not indicative of the company’s continuing operating results. The company’s management uses these non-GAAP financial measures as an indicator for planning and forecasting future periods. These non-GAAP measures have limitations as analytical tools and should not be considered in isolation or as a substitute for analysis of our results as reported under GAAP. Our presentation of these Non-GAAP financial measures should not be construed as an inference that our future results will be unaffected by other income and expenses that are unusual, non-routine or non-recurring.
(This page left blank intentionally.)
BLACK HILLS CORPORATION
ANNUAL MEETING OF SHAREHOLDERS
Tuesday, April 26, 201625, 2017
9:30 a.m., Local Time
The Dahl Fine Arts Center 713 Seventh Street Rapid City, SD 57701
Important Notice Regarding the Availability of Proxy Materials for the Annual Meeting:
The Notice and Proxy Statement and our 20152016 Annual Report to Shareholders are available at www.blackhillscorp.com.
| | | | | Black Hills Corporation | | | | 625 Ninth Street, Rapid City, SD 57701 | | PROXY |
This proxy is solicited by the Board of Directors for use at the Annual Meeting on April 26, 2016.25, 2017.
The undersigned hereby appoints David R. Emery, Steven J. HelmersBrian G. Iverson and Richard W. Kinzley, and each of them, with full power of substitution, to vote all shares of the undersigned at the Annual Meeting of Shareholders to be held at 9:30 a.m., local time, April 26, 2016,25, 2017, at The Dahl Fine Arts Center, 713 Seventh Street, Rapid City, SD 57701, and at any adjournment thereof, upon all subjects that may properly come before the meeting, including the matters described in the Proxy Statement furnished herewith.
Your vote is important! Ensure that your shares are represented at the meeting.
Either (1) submit your proxy by touchtone telephone, (2) submit your proxy by Internet, or (3) mark, date, sign, and return this proxy in the envelope provided. If no directions are given, properly executed proxies will be voted in accordance with the Board of Directors' recommendation on all matters listed on this proxy, and at their discretion on any other matters that may properly come before the meeting.
See reverse for voting instructions.
VOTE BY INTERNET, TELEPHONE OR MAIL 24 HOURS A DAY, 7 DAYS A WEEK
Your phone or Internet vote authorizes the named Proxies to vote your shares in the same manner as if you marked, signed and returned your proxy card.
VOTE BY INTERNET/MOBILE — www.proxypush.com/bkh Use the Internet to vote your proxy until 11:59 p.m. (CT) on April 25, 2016.24, 2017.
VOTE BY PHONE— 1-866-883-3382 Use a touch-tone telephone to vote your proxy until 11:59 p.m. (CT) on April 25, 2016.24, 2017.
VOTE BY MAIL Mark, sign and date your proxy card and return it in the postage-paid envelope provided.
If you vote your proxy by Internet or by Telephone, you do NOT need to mail back your Proxy Card.
The Board of Directors Recommends a Vote FOR the Nominees in Item 1, and FOR Items 2 and 3, and ONE YEAR for Item 4. | | | | | | | | | | | | | | | | Vote FOR ¨ | | Vote WITHHELD ¨ | | | 1. | Election of Directors: | 01 Gary L. PechotaDavid R. Emery | all nominees | | from all nominees | | | | | 02 Mark A. SchoberRobert P. Otto | (except as marked) | | | | | | | | | 03 Thomas J. ZellerRebecca B. Roberts | | | | | | | | | | | | 04 Teresa A. Taylor | | | | | | | | | | | 05 John B. Vering | | | | | | | | |
| | | | | | (Instructions: To cumulate votes for any indicated nominee, write | | | | the number(s) of the nominee(s) and the number of shares for such nominee | | | | in the box provided to the right.) | |
| | | | | | | | | | | | | | | For | Against | Abstain | | 2. | AuthorizationRatification of an increase inthe appointment of Deloitte & Touche LLP to serve as Black Hills Corporation's authorized indebtedness from $4 billion to $8 billion.independent registered public accounting firm for 2017. | | | | | | | | | |
| | | | | | | | | | | | | | | For | Against | Abstain | | 3. | Ratification of the appointment of Deloitte & Touche LLPAdvisory resolution to serve as Black Hills Corporation's independent registered public accounting firm for 2016.approve executive compensation. | | | | | | | | | |
| | | | | | | | | | | | | | | | | | For1 Year | Against2 Years | 3 Years | Abstain | | 4. | Advisory resolution to approvevote on the frequency of the advisory vote on our executive compensation. | | | | | | | | | | | | |
THIS PROXY WHEN PROPERLY EXECUTED WILL BE VOTED AS DIRECTED OR, IF NO DIRECTION IS GIVEN, WILL BE VOTED FOR THE NOMINEES IN ITEM 1, AND FOR ITEMS 2 AND 3, ANDONE YEAR FOR ITEM 4. | | | | | | Address change? Mark Box | ¨ | | | | Indicate changes below: | | | Date ___________________________________________ |
Please sign exactly as your name(s) appear on Proxy. If held in joint tenancy, all persons should sign. Trustees, administrators, etc., should include title and authority. Corporations should provide full name of corporation and title of authorized officer signing the Proxy.
|